

XRPUSDT presses the bottom of the range as Ripple crypto today trades under extreme fear

Market conditions are tense as Ripple crypto today trades under extreme fear while XRP presses against key technical levels across multiple timeframes.
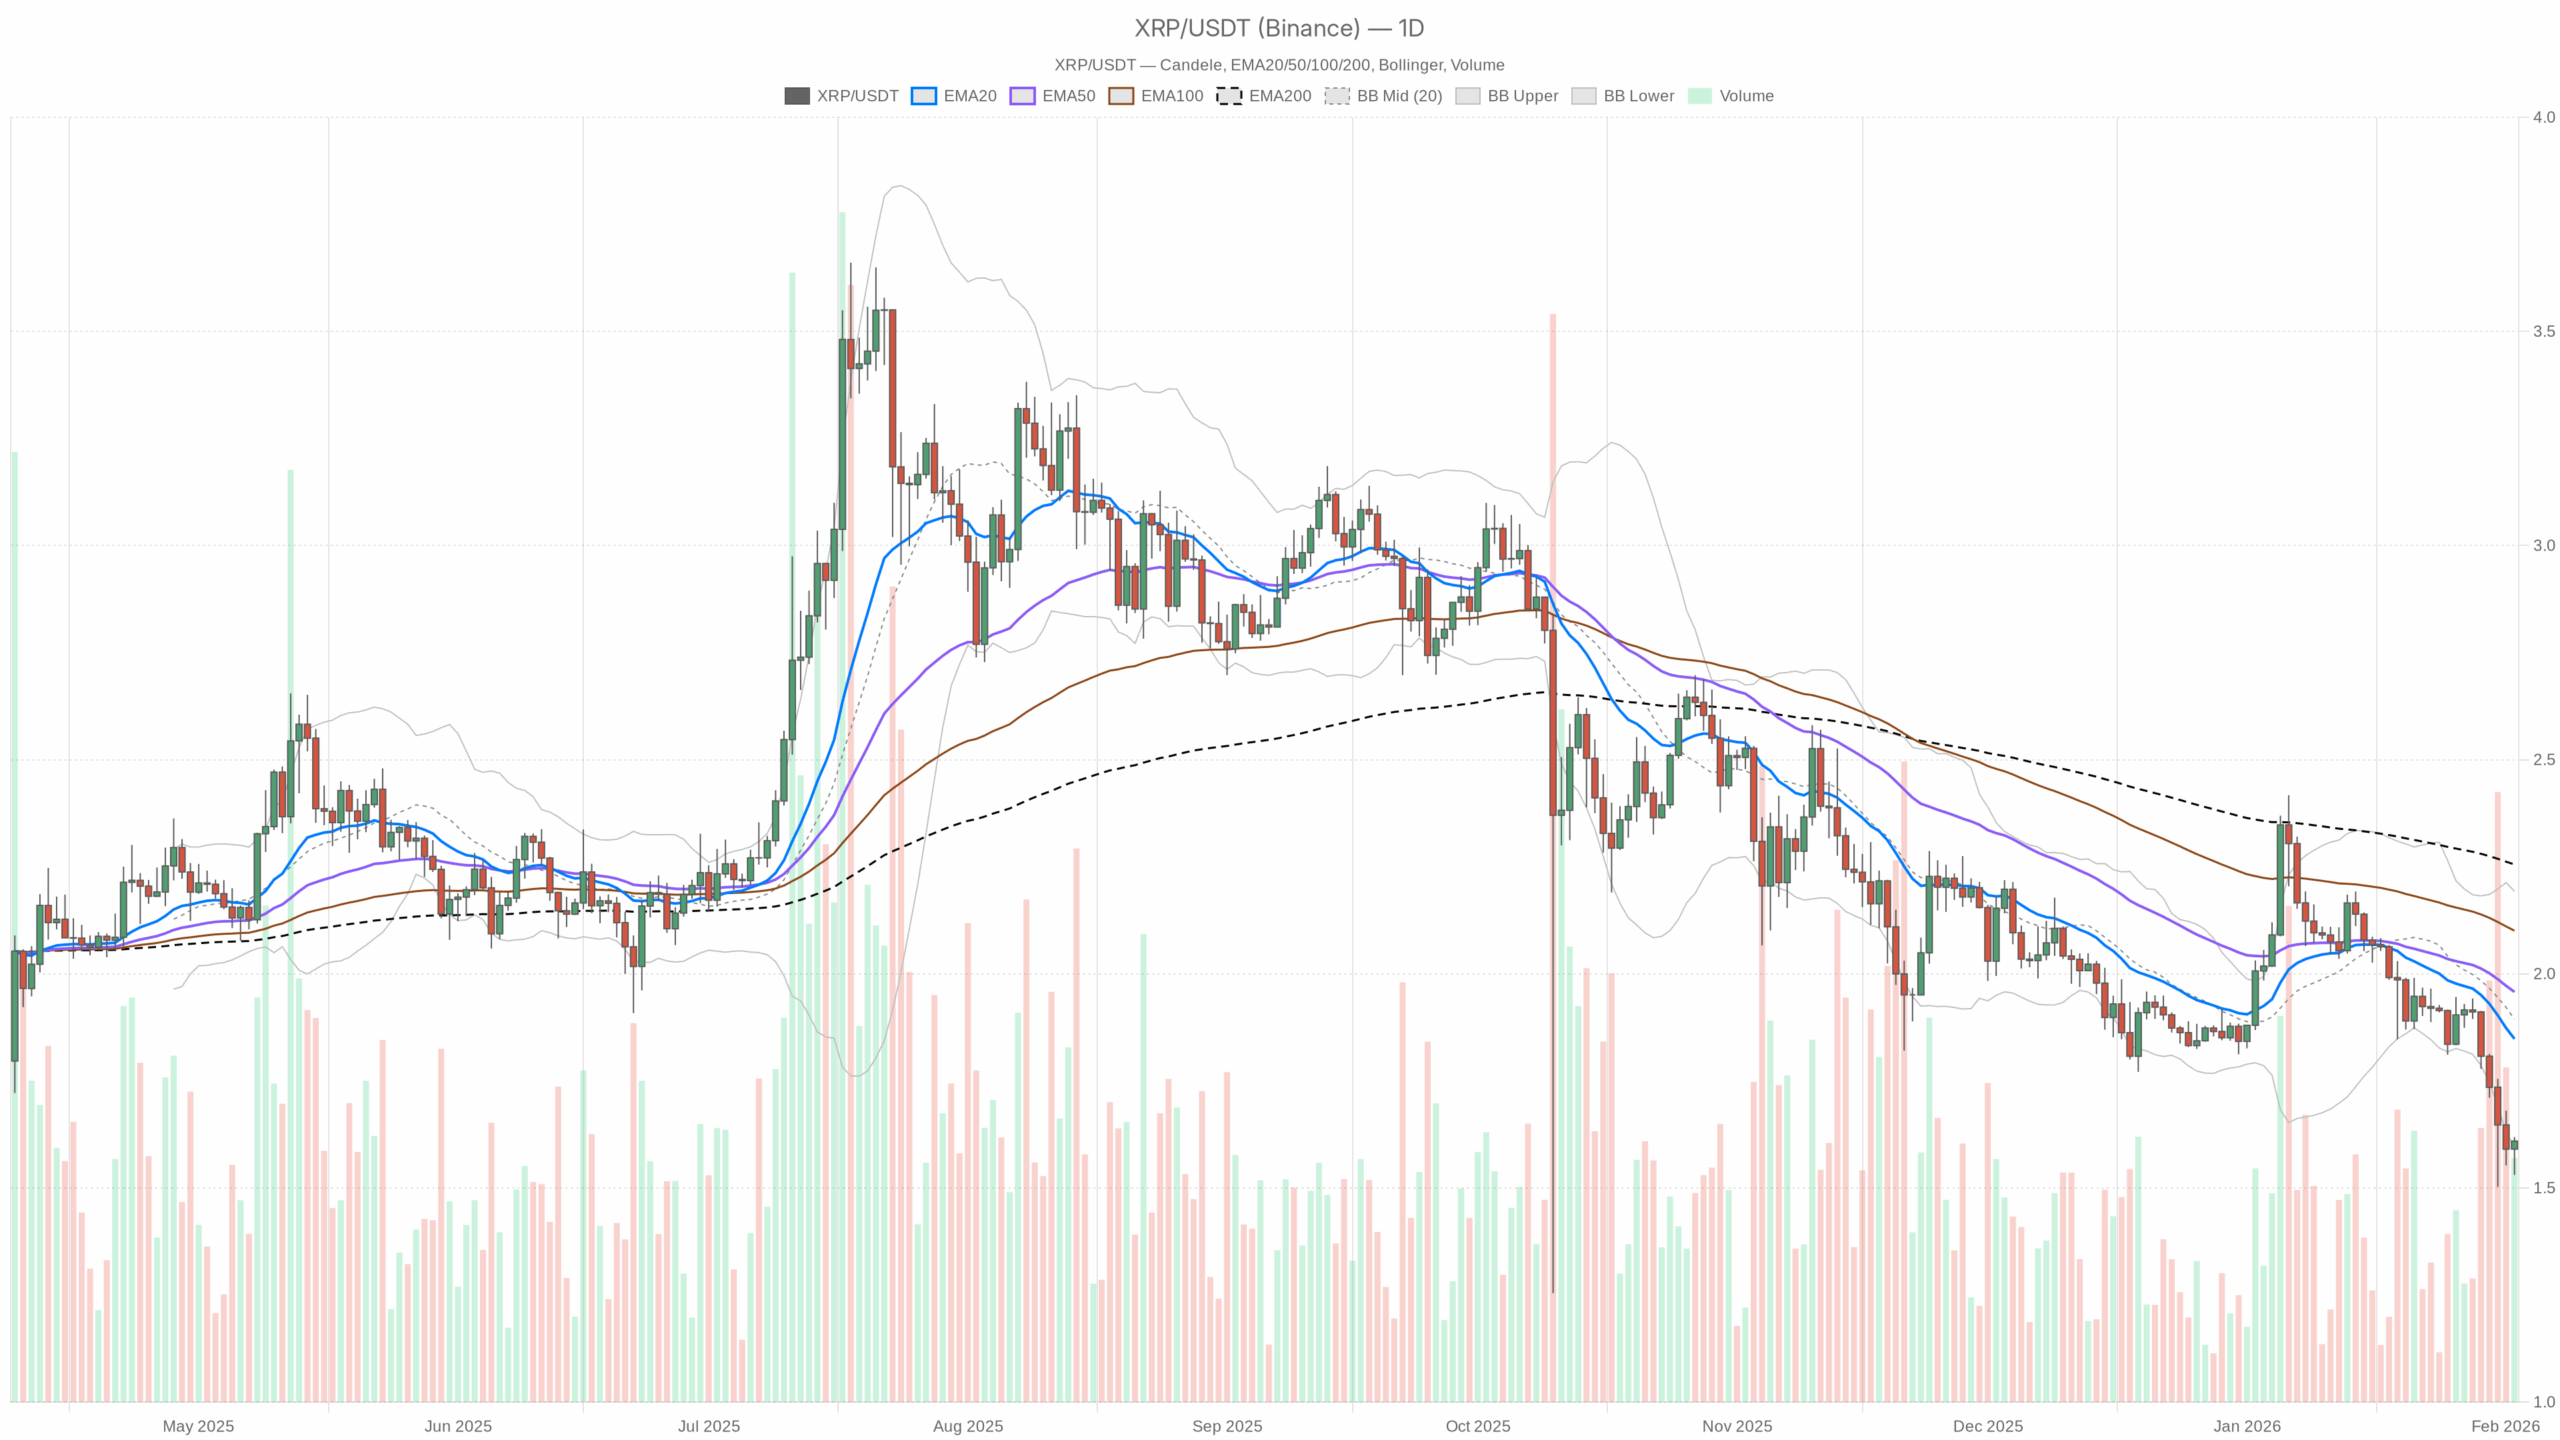 EMA20, EMA50 and volume”
loading=”lazy” />XRP/USDT — daily chart with candlesticks, EMA20/EMA50 and volume.
Daily (D1): The dominant bearish backdrop
Trend structure: EMAs
Price vs EMAs (D1)
Close: 1.61
EMA20: 1.85
EMA50: 1.96
EMA200: 2.26
Regime: bearish
Price is trading well below all three key EMAs, and they are stacked bearishly (20 < 50 < 200). That is a mature downtrend, not a fresh dip. The distance from the 20-day EMA shows XRP has been persistently sold and has not even attempted a serious mean-reversion move yet. Structural bias on D1 is clearly down.
Momentum: RSI
RSI14 (D1): 28.21
Daily RSI is below 30, firmly in oversold territory. That tells you two things at once: the downtrend has been strong, but the market is also stretched. At these levels, the next big move is often a fight between trend traders pressing shorts and contrarians betting on a snapback rally.
Momentum quality: MACD
MACD (D1)
Line: -0.10
Signal: -0.06
Histogram: -0.04
The MACD line is below the signal and both are below zero, with a negative histogram. That confirms the bearish momentum we see in price and EMAs. However, the histogram is not deeply negative; this is not a capitulation spike, more like a controlled grind lower. Bears are in charge, but they are not in a panic.
Volatility and location: Bollinger Bands
Bollinger Bands (D1)
Middle band: 1.89
Upper band: 2.19
Lower band: 1.60
Close: 1.61
XRP is sitting almost exactly on the lower band at 1.60–1.61. Price hugging the lower band after a sustained decline means the market is walking the band lower rather than sharply rejecting it. This is where things get tricky: it is both a danger zone for breakdowns and a common area for short-covering bounces. It signals pressure, not necessarily immediate reversal.
Volatility intensity: ATR
ATR14 (D1): 0.10
Average daily range around 0.10 on a 1.61 price is roughly a 6–7% typical swing per day. That is active but not extreme for XRP. Volatility is elevated enough to punish tight stops but not in full-blown panic mode. For position sizing, this argues for respecting the noise, because being too tight with risk will get clipped.
Short-term levels: daily pivots
Daily pivot levels (D1)
Pivot (PP): 1.59
Resistance 1 (R1): 1.64
Support 1 (S1): 1.55
Price at 1.61 is just above the daily pivot at 1.59. Immediate intraday resistance sits near 1.64, while 1.55 is the first downside line in the sand. With daily trend down and sentiment in extreme fear, these levels can act more as stops and trap zones than long-term turning points.
1H: Attempted stabilization against a bearish daily backdrop
Trend structure: EMAs
Price vs EMAs (1H)
Close: 1.61
EMA20: 1.60
EMA50: 1.63
EMA200: 1.76
Regime: neutral
On the 1-hour chart, price is basically riding the 20-EMA and slightly under the 50-EMA, while remaining well under the 200-EMA. This is short-term balance inside a larger downtrend. Intraday players are trying to form a base, but the distance to the 200-EMA reminds you the bigger picture is still heavy.
Momentum: RSI
RSI14 (1H): 51.23
RSI hovering just above 50 tells you the intraday move has normalized after prior selling. There is no immediate overbought or oversold signal here; it is a pause, not a conviction push in either direction. This lines up with the idea of a short-term consolidation under higher timeframe pressure.
Momentum quality: MACD
MACD (1H)
Line: -0.01
Signal: -0.02
Histogram: 0.00
The MACD on 1H is essentially flat around the zero line with a negligible histogram. That fits a market that is catching its breath. Momentum is neither strongly bullish nor bearish intraday; the 1H is not giving a clear edge on direction, it is just saying the selling rhythm has slowed.
Volatility and location: Bollinger Bands
Bollinger Bands (1H)
Middle band: 1.59
Upper band: 1.62
Lower band: 1.56
Close: 1.61
Price has drifted back toward the upper half of the 1H band set, slightly above the mid-band. That is a soft intraday recovery from lower levels, but not an aggressive breakout. Until price can sustain above the upper band with volume, this looks more like range trading than a trend shift.
Volatility intensity: ATR
ATR14 (1H): 0.04
On the hourly, typical swings of around 0.04 show that intraday ranges are meaningful but contained. For traders, that means the immediate risk is more about slow grind and stop-outs than violent spikes, unless the daily breakdown or a short squeeze triggers.
Intraday levels: hourly pivots
Hourly pivot levels (1H)
Pivot (PP): 1.61
Resistance 1 (R1): 1.62
Support 1 (S1): 1.60
Price trading right at the hourly pivot underscores the neutral, indecisive tone on 1H. Small breaks above 1.62 or below 1.60 can trigger short-lived moves, but they need follow-through to matter against the bearish daily structure.
15m: Execution noise inside a fragile balance
Trend structure: EMAs
Price vs EMAs (15m)
Close: 1.61
EMA20: 1.59
EMA50: 1.59
EMA200: 1.63
Regime: neutral
On the 15-minute chart, price is slightly above the 20 and 50 EMAs but still below the 200 EMA. That is a light intraday bounce within a broader intraday downtrend. For execution, this is the kind of micro uptrend scalpers like to fade back into the larger daily direction unless it starts to extend.
Momentum: RSI
RSI14 (15m): 60.98
Short-term RSI is leaning bullish but not overheated. Buyers have the micro-timeframe initiative, but they are pushing into higher timeframe resistance. That often sets up either a continuation squeeze higher if daily shorts flinch, or a fresh entry point for bears if the bounce stalls.
Momentum quality: MACD
MACD (15m)
Line: 0.01
Signal: 0.01
Histogram: 0.00
The 15m MACD is marginally positive and flat. It confirms a mild upward bias intraday but nothing explosive. Again, this is more about a relief move than a trend reversal signal on its own.
Volatility and location: Bollinger Bands
Bollinger Bands (15m)
Middle band: 1.59
Upper band: 1.62
Lower band: 1.56
Close: 1.61
Price is trading toward the upper half of the 15m band set, consistent with the small intraday bid. For short-term traders, this is where you watch whether XRP can ride the upper band toward 1.64–1.70 or simply oscillate and roll back over.
Volatility intensity: ATR
ATR14 (15m): 0.01
Typical 15m swings of about 0.01 show that execution needs to factor in tight but meaningful noise. Entries too close to obvious intraday levels risk being flushed by routine volatility.
Intraday levels: 15m pivots
15m pivot levels (15m)
Pivot (PP): 1.61
R1: 1.61
S1: 1.61
The 15m pivots collapsing around the current price tell you volatility has contracted recently and the market is in a micro-balance. From such compressions, you usually get a directional move, and timing plus alignment with the higher timeframes are what matter.
Sentiment and macro context: risk is defensive, not speculative
Broader crypto metrics show a total market cap around $2.69T, down ~1.2% in 24h, with Bitcoin dominance at 57.6%. That is a market leaning into Bitcoin as a relative safe haven rather than chasing altcoin risk. The Fear & Greed Index at 14 (Extreme Fear) confirms traders are more interested in protection than in squeezing the last bit of yield out of speculative names.
For XRP specifically, this macro setting amplifies the downside bias. When risk is being trimmed and dominance is rising, lagging altcoins under their EMAs tend to stay under pressure unless there is a strong, asset-specific catalyst.
Main scenario for Ripple crypto today: bearish, but stretched
Putting it all together:
- Daily trend and structure: Clearly bearish, with price under all EMAs, MACD negative, and hugging the lower Bollinger Band.
- Daily momentum: Oversold RSI around 28, signaling a stretched but intact downtrend.
- Intraday (1H and 15m): Neutral to slightly constructive, with short-term mean reversion attempts inside a larger downtrend.
- Sentiment: Extreme fear, BTC dominance high and rising, showing a risk-off tone.
The dominant force is the bearish daily trend under risk-off conditions, so the main scenario for XRPUSDT today remains bearish. The key nuance is that the market is ripe for a reflex bounce, but until that bounce proves itself on the daily chart, it remains a counter-trend move, not a new uptrend.
Clear bullish and bearish scenarios
Bullish scenario: oversold bounce and mean reversion
For a bullish short- to medium-term scenario, buyers need to turn this oversold condition into an actual reversal attempt, not just a dead-cat bounce.
What the bulls want to see:
- Daily close solidly above 1.64 (around today’s R1), ideally pushing toward the daily mid-BB near 1.89.
- RSI14 on D1 lifting back above 35–40, suggesting the worst of the selling wave has passed.
- MACD histogram on D1 starting to contract toward zero, signaling that downside momentum is fading.
- On 1H, price reclaiming and holding above the EMA50 (1.63), then targeting the area between 1.70–1.80 as a first mean reversion pocket.
In that environment, short-term traders would treat dips toward 1.55–1.60 as potential buy-the-dip zones, aiming for a move back toward the 20-day EMA at 1.85–1.90. The bullish case is essentially a counter-trend rally capitalizing on extreme fear and oversold conditions.
What invalidates the bullish scenario?
A clean break and daily close below 1.55, especially if accompanied by RSI staying sub-30 and MACD widening lower, would suggest that what looked oversold was simply the start of a deeper leg down. In that case, the bounce thesis is wrong or at least early.
Bearish scenario: breakdown from the lower band
The bearish scenario is an extension of the existing trend, with the current pause on intraday charts resolving lower.
What the bears want to see:
- Daily close below the lower Bollinger Band and under 1.55 support, turning that area into resistance.
- RSI14 staying below 30 or even pushing into the low 20s, confirming persistent pressure.
- MACD line and histogram on D1 making new lows, showing renewed downside momentum, not just sideways drift.
- On 1H and 15m, failed rallies into 1.62–1.64 that quickly reverse, forming lower highs under the 50-EMA.
Under this scenario, XRP would leave the current 1.55–1.64 range behind and start exploring lower support zones, structurally below the current band. In practice, that is when trend-following shorts remain in control and every intraday bounce is sold.
What invalidates the bearish scenario?
If XRP can reclaim and hold above the daily 20-EMA at 1.85 with RSI back above 40 and MACD flattening, the narrative shifts from trend continuation to a larger corrective rally. At that point, the clean bearish continuation thesis is broken, and sellers need to reassess.
How to think about positioning in this environment
Ripple crypto today is caught between a bearish higher timeframe trend and a tired, oversold momentum profile. That combination often creates choppy trading: sharp, fast bounces inside a broader downtrend, with volatility punishing both slow bears and impatient bulls.
Key takeaways for traders analyzing XRPUSDT right now:
- The daily downtrend is still the anchor. Until price gets back above at least the 20-day EMA, any rally is technically a counter-trend move.
- Oversold RSI and price at the lower Bollinger Band argue against initiating fresh, late shorts without a clear breakdown.
- Intraday charts (1H, 15m) show attempts at stabilization. These can evolve into either a tradable bounce or a better entry for trend continuation shorts, depending on how 1.55–1.64 resolves.
- Extreme fear in the broader market and rising BTC dominance mean the path of least resistance for altcoins is still cautious to negative unless a broader relief rally kicks in.
Volatility is present but not explosive, so the main risk here is grinding drawdowns and whipsaws rather than a single, spectacular candle. Whatever the directional bias, managing exposure size and respecting the daily trend structure matter more than focusing on every 15m tick.
If you want to monitor markets with professional charting tools and real-time data, you can open an account on Investing using our partner link:
Open your Investing.com account
This section contains a sponsored affiliate link. We may earn a commission at no additional cost to you.
This analysis is for informational and educational purposes only and does not constitute investment, trading, or financial advice. Markets are volatile and unpredictable; always conduct your own research and consider your risk tolerance before making any trading decisions.
You May Also Like

Heitman and Erben to Develop Western Australia’s Largest PBSA asset in the core of Perth CBD

Hims & Hers to Announce Fourth Quarter and Full Year 2025 Financial Results on February 23, 2026

Wormhole token soars following tokenomics overhaul, W reserve launch
Wormhole’s native token has had a tough time since launch, debuting at $1.66 before dropping significantly despite the general crypto market’s bull cycle. Wormhole, an interoperability protocol facilitating asset transfers between blockchains, announced updated tokenomics to its native Wormhole (W) token, including a token reserve and more yield for stakers. The changes could affect the protocol’s governance, as staked Wormhole tokens allocate voting power to delegates.According to a Wednesday announcement, three main changes are coming to the Wormhole token: a W reserve funded with protocol fees and revenue, a 4% base yield for staking with higher rewards for active ecosystem participants, and a change from bulk unlocks to biweekly unlocks.“The goal of Wormhole Contributors is to significantly expand the asset transfer and messaging volume that Wormhole facilitates over the next 1-2 years,” the protocol said. According to Wormhole, more tokens will be locked as adoption takes place and revenue filters back to the company.Read more