

Bitcoin Price History in 2009, 2010, 2011, 2012, 2013, 2014 & Beyond
Bitcoin’s beginnings go back to 2009, which means it’s been around for over 15 years. Imagine buying Bitcoin for a fraction of a cent back then, only to see it skyrocket to tens of thousands of dollars in the years that followed, with the current price over $120,000.
Let’s take a journey through the key milestones in Bitcoin’s price evolution, year by year, and uncover the factors that drove its dramatic fluctuations. We are going to examine Bitcoin’s eventful past and highlight the most important events and developments in its 16-year history.
Key takeaways:
- Bitcoin started in 2009 with an initial value of effectively $0 and saw its first recorded market price at $0.00099 per coin in October.
- In 2010, the price fluctuated from $0.0008 to a peak of $0.39, ending the year at $0.30.
- Bitcoin’s price in 2011 began at $0.30, peaked at $29.60, and ended at $5.27, showcasing high volatility.
- The year 2012 saw a 152% increase, starting at $5.27 and ending at $13.30, with the first Bitcoin halving event in November.
- Bitcoin’s price surged significantly in 2013, from $13 to a peak of $1,156, a rise of over 8,800% within the year.
What was the price of Bitcoin in 2009?
Bitcoin’s journey began in 2009 with an initial value of effectively $0, as it hadn’t yet been traded on exchanges. You might be wondering what the first “above zero” price of Bitcoin was in 2009.
Well, the first recorded market price for Bitcoin occurred in October 2009, when it was valued at about $0.00099 per coin for a small transaction. Just for perspective’s sake, if you had invested only $10 in Bitcoin back then and kept it until now, that investment would now be worth around $5 million.
In Bitcoin’s early years, there was minimal public awareness of it and there was very little trading involved. In fact, the first real-world transaction didn’t happen until May 2010, which we will talk about in the next section.
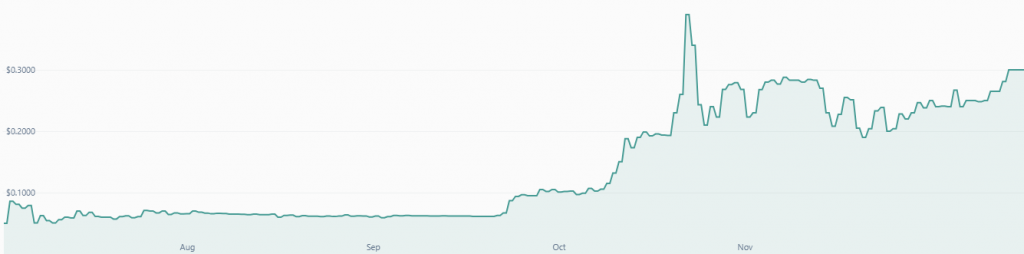
What was the price of Bitcoin in 2010?
In 2010, the price of Bitcoin began to show signs of life, starting the year at approximately $0.0008 and demonstrating noteworthy early volatility.
For most of 2010, Bitcoin traded under $0.10, with its price peaking at $0.39 in early November 2010. This marked a notable increase from its starting value earlier in the year. By the end of 2010, Bitcoin closed the year at about $0.30, which was a remarkable increase of approximately 500% since the beginning of the year.
One of the most notable events in 2010 was the first real-world transaction, where 10,000 Bitcoins were used to purchase two pizzas, effectively pricing Bitcoin at $0.0025 each at that time. This transaction highlighted Bitcoin’s potential as a medium of exchange and marked an early step toward broader adoption.
Throughout 2010, Bitcoin’s price fluctuated considerably. It was a reflection of the asset’s speculative nature during its early days. The price movements of Bitcoin in 2010 laid the groundwork for its future growth and the increasing interest in this digital currency.
What was the price of Bitcoin in 2011?
The year 2011 was a vital moment for Bitcoin, as it experienced its first major rally. You see, Bitcoin’s price history in 2011 began with a value of around $0.30 and ended the year at approximately $5.27. Throughout the year, Bitcoin’s price was characterized by significant volatility, including fluctuations between $0.30 and $30.
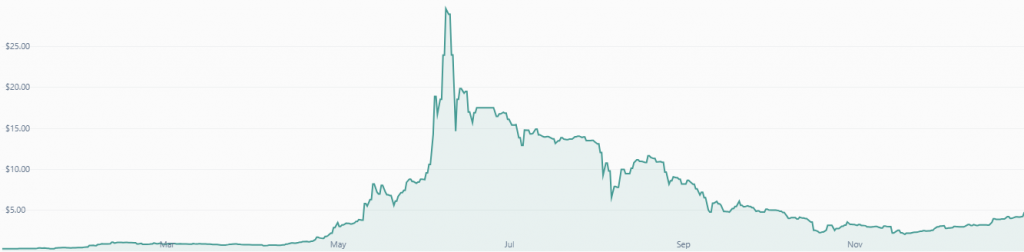
The price surged to a peak of about $29.60 in June 2011, marking a substantial increase from its starting point. This volatility was influenced by various factors, including market sentiment and regulatory shifts.
As Bitcoin gained wider attention beyond early adopters, its market cap increased substantially. This, in turn, prompted more public and media interest in the cryptocurrency. This increased visibility contributed to Bitcoin’s price surge in 2011.
The year witnessed notable price fluctuations, reflecting the inherent volatility of cryptocurrency markets. Despite the fluctuations, Bitcoin’s price history in 2011 laid the groundwork for its future growth and adoption.
What was the price of Bitcoin in 2012?
From the significant price fluctuations of 2011, where Bitcoin’s value surged to a peak of about $29.60 in June and ended the year at approximately $5.27, we move to the following year, which saw a different trend.
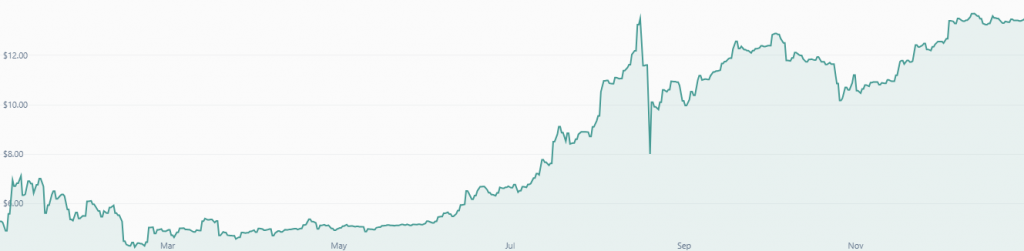
In 2012, Bitcoin’s price started the year at approximately $5.27 and ended at around $13.30. This was a growth of about 152% over the year, which would be considered astronomical in any market that isn’t crypto.
This price increase was influenced by the first Bitcoin halving event in November 2012, which reduced mining rewards from 50 BTC to 25 BTC.
Throughout 2012, Bitcoin experienced fluctuations between approximately $4 and $16 as it gained traction among early adopters and investors.
What was the price of Bitcoin in 2013?
2013 was an absolutely pivotal year for Bitcoin. Its price skyrocketed from around $13 to a peak of approximately $1,100 in December. This was an astonishing increase of over 8,800% within the year, a truly ludicrous amount even by crypto standards.

This significant growth was partly due to increased media exposure and the rise of cryptocurrency exchanges, which contributed to Bitcoin’s market popularity surge.
By the end of April, Bitcoin’s price had surpassed $200, and by December, the price hit the peak of $1,100. The year ended with Bitcoin closing at around $730 after experiencing substantial volatility throughout the year.
The price movements in 2013 were heavily influenced by several events, including the shutdown of the Silk Road marketplace and growing interest from both retail and institutional investors.
As part of Bitcoin’s price history, 2013 stands out as a year of remarkable growth and increased recognition in the financial and technological communities. Arguably, this was the first time the term Bitcoin was starting to be ushered by regular people who aren’t investors or finance professionals.
What was the price of Bitcoin in 2014-2015?
The years 2014-2015 are mostly a part of Bitcoin’s story that shows resilience and gradual recovery.
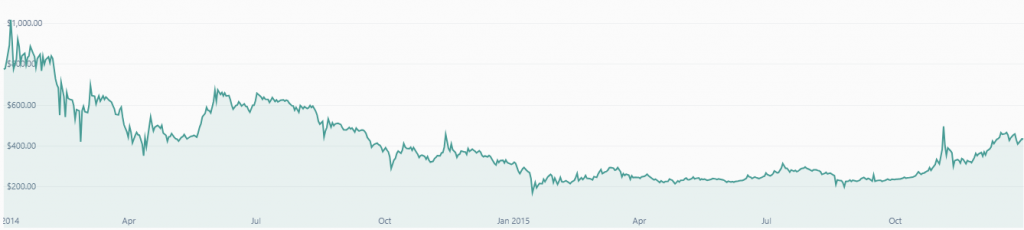
In 2014, Bitcoin’s price started at approximately $770 but fell considerably throughout the year, ending around $315. This decline was largely due to the Mt. Gox exchange hack and increased regulatory scrutiny.
The price fluctuation in 2014 saw Bitcoin dip to a low of about $200 before initiating a small recovery towards year-end.
At the end of 2015, Bitcoin’s price closed out at around $425, a significant decrease from the highs of 2013, but still much higher than where it first started.
What was the price of Bitcoin in 2016-2017?
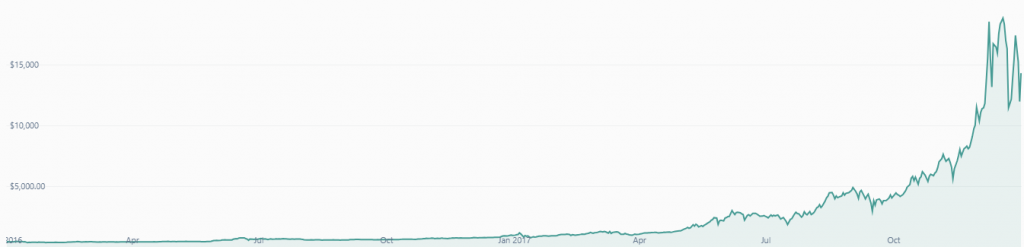
In 2016, we saw the price of Bitcoin grow steadily throughout the year. It starts at around $430 and closes at approximately $960. Unlike previous increases in price, 2016 was quite tame by Bitcoin’s standards, without much in the way of volatility that crypto is known for.
This steady growth was a reflection of increasing confidence in Bitcoin’s potential and improving market conditions.
In 2017, Bitcoin’s price history took a dramatic turn.
By January, the price had surpassed $1,000, a significant psychological milestone. The year witnessed a massive bull run, with Bitcoin soaring to nearly $20,000 by December 2017. This surge was fueled by rising public interest, media coverage, and increased investment, both institutional and retail.
The dramatic price swings during this period also reflected expansion into alternative cryptocurrencies, and it is at this point that the term “altcoins” started to be more widely used.
2017 was a perfect example of the aggressive volatility of Bitcoin.
What was the price of Bitcoin in 2018-2023?
By 2018, Bitcoin’s price was near $13,880 but saw a significant decline to around $3,200 by December, marking a drop of nearly 77%. The following year, Bitcoin recovered some ground, fluctuating between $3,200 and $14,000 before closing at approximately $7,200.
In 2020, Bitcoin’s price surged dramatically, driven by increased institutional interest and a favorable macroeconomic environment, ending the year at around $28,993, which was a 416% increase from the beginning of the year.
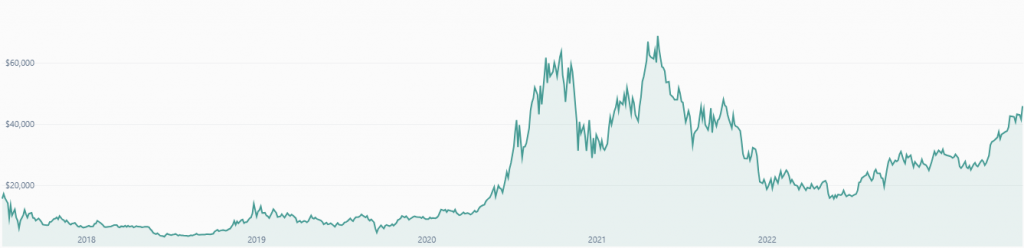
It reached new all-time highs in 2021, peaking at around $69,000 in November before experiencing notable corrections, ultimately closing at around $46,200.
2022 and 2023 have, for the most part, not been great for Bitcoin’s price. For the better part of those 24 months, the price was oscillating between $16,000 and $40,000, roughly. However, towards the end of 2023, specifically in November and December, the price finally started gaining upwards momentum and broke above $40,000.
Bitcoin’s 2024 bull run to $100,000
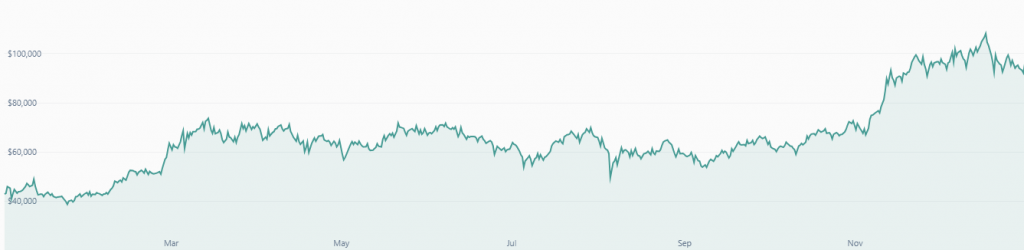
Bitcoin’s price in the first 3 months of 2024 has seen significant increases and even broke the previous all-time high in March, setting a new ATH of around $73,000.
The second and third quarters were not as impressive, though they were far from disappointing either. The price had been ranging between $57,000 and $71,000 for most of the mid-year.
This early surge in 2024 can be attributed to the continued growth of institutional interest and regulatory changes that positively impacted the market. The peak itself was likely influenced by the approval of several spot Bitcoin ETFs early in the year, which helped boost investor confidence and drive up demand. Also, the aftermath of the banking crisis in early 2023 saw Bitcoin experience a notable rebound, climbing from around $28,038 to its mid-2024 levels.
However, the final months of 2024 completely changed the narrative. In November, Bitcoin’s price surged again following the U.S. presidential election, which sparked renewed optimism in the crypto markets. BTC quickly climbed to a new all-time high of $94,837, before breaking the $100,000 barrier in December, reaching a record $106,052.
By the end of 2024, Bitcoin had established a new price floor, holding above $90,000 and closing the year at around $93,647 — marking a remarkable 222% increase from the start of the year.
Bitcoin’s price in 2025

Bitcoin carried over the momentum from 2024, reaching a new local high of $106,198 in January. However, that rally was short-lived. Over the following months, Bitcoin entered a sharp correction, dropping to levels many believed were no longer possible – first falling below $95,000, then $80,000 just two weeks later, and eventually bottoming out at $76,352 in April. Many analysts proclaimed this to be the end of Bitcoin’s bull run, while a few contrarian investors saw it as a rare opportunity to accumulate Bitcoin at a discount.
Those investors turned out to be right. Bitcoin shocked the market with a massive reversal shortly afterward. By May, the price had regained the psychological $100,000 level, signaling renewed market strength. The momentum didn’t stop there — Bitcoin’s rally accelerated, breaking through $110,000, briefly pulling back to $100,000, and then surging past $120,000.
After another short dip to $110,000, Bitcoin climbed once again to reach a new all-time high of $126,000 in October. The rally was driven by continued institutional demand, ETF inflows, and growing retail participation fueled by positive macroeconomic sentiment.
As 2025 drew to a close, many investors believed it could reach $150,000 or even higher by year’s end. However, the price would begin dropping sharply after the $126,000 peak. It fell below the $100,000 mark in November and headed into 2026 below the $90,000 level, effectively bringing Bitcoin back to roughly the same price range where it started 2025.
Bitcoin’s price in 2026 so far

Bitcoin continued the bearish momentum from 2025 to the current year. The price held steady around $90,000 until February. In a mere week, the price dropped to $65,000 levels, where it has been trading for the rest of February. It remains to be seen where the price of Bitcoin will go later in the year, but many analysts are optimistic about Bitcoin’s future and see the current price drop as a mere road bump.
If you want to check algorithmically generated forecasts, make sure to visit our Bitcoin price prediction page.
The bottom line: Bitcoin started at less than a tenth of a cent, now comfortably above $120k
You’ve seen Bitcoin’s price history, from its negligible value in 2009 to its meteoric rise over the years. In 2010, it peaked at $0.39, then hit $30 in mid-2011. The price has continued to fluctuate, reaching above $1,100 in 2013, dropping, and then growing again to almost $20,000 through 2016-2018.
Despite volatility, Bitcoin has shown steady growth, with its price continuing to rise through 2026 and (very likely) beyond.
You May Also Like

Bitcoin ETFs Surge with 20,685 BTC Inflows, Marking Strongest Week

CEO Sandeep Nailwal Shared Highlights About RWA on Polygon
