XRP could be approaching an inflection point as a closely watched chart pattern tightens into its apex and broader “risk-on” signals in equities flash green, accordingXRP could be approaching an inflection point as a closely watched chart pattern tightens into its apex and broader “risk-on” signals in equities flash green, according

XRP Breakout Possible Before The Weekend, Expert Says

2026/01/17 11:00

XRP could be approaching an inflection point as a closely watched chart pattern tightens into its apex and broader “risk-on” signals in equities flash green, according to XRPL developer Bird (@Bird_XRPL).

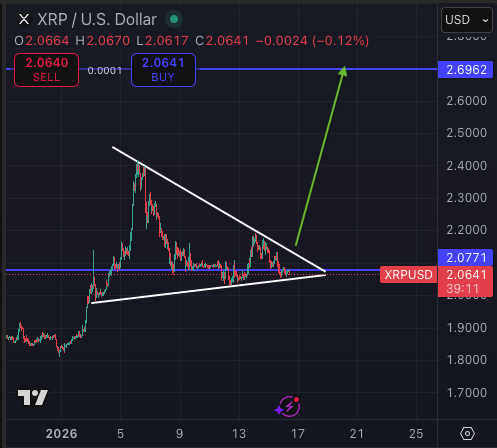
In a series of posts on X, Bird, the developer behind XRPL meme coin DROP, pointed to XRP’s hourly structure as setting up for a decisive move “before the end of the week,” arguing that a technical breakout could accelerate quickly toward a nearby upside objective.

“Take a look at XRP on the hourly. A move is about to happen before the end of the week,” Bird wrote alongside a chart showing a contracting triangle with price compressing into the tip. “A measured move if we send upwards could push us straight to that $2.69 mark which finally gets us into ‘bull run’ mode.”

XRP price analysis, 1-hour chart

Russell 2000 Breakout Puts XRP on Alert

Beyond the short-term pattern, Bird anchored his thesis to US small caps, arguing that the Russell 2000’s behavior has historically mattered for XRP and the broader altcoin complex.

“The Russell 2000 is about to close its highest weekly close in history. That matters ALOT for XRP,” Bird said. “Historically, XRP and altcoins have always tracked the Russell 2000 extremely closely. It’s the true risk on index for mid caps (not mega caps like the S&P or MAG7 where most capital has been parked).”

Bird’s argument is that XRP still trades more like a mid-cap risk asset than a mega-cap “store of value” proxy, making the Russell’s breakout a useful macro tell for when speculative capital rotates back into higher beta exposures. He described the current backdrop as “capital rotating” and “risk … back on,” suggesting that the market may be entering a window where positioning can change quickly if narratives align.

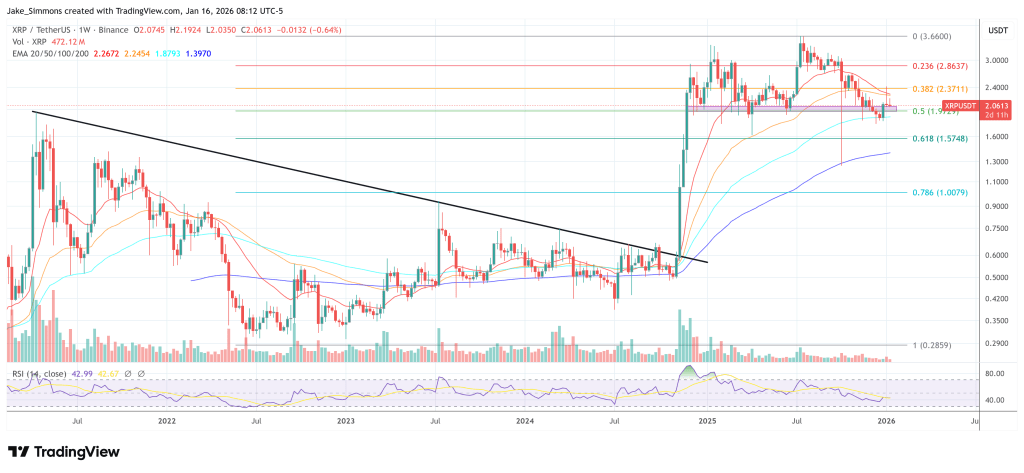
In a longer follow-up thread, Bird described XRP’s extended consolidation as increasingly out of sync with what he views as constructive macro conditions across risk assets.

“We’re at a genuinely clinical moment for XRP. We’ve gone sideways for over a year, yet the Russell 2000 is now in full price discovery, other stock markets have been at all time highs for a long time, metals are elevated, and Bitcoin dominance is chopping at levels that historically dumps at,” he wrote.

Bird also pointed to a prior episode as a reference point: “In November ’24, the Russell turned green and XRP went parabolic roughly 10 days later,” he said, arguing that this time the Russell has gone further by reclaiming highs and holding strength across timeframes. In his view, the remaining constraint is rotation, not necessarily a sharp drawdown in metals or other assets, but simply a pause that allows risk appetite to re-price.

On XRP and Ripple specific context, Bird said “acquisitions done, partnerships rolling out, NDAs lifting, legal clarity forming,” and argued that the market is nearing a point where “a single narrative, catalyst, or push can ignite XRP fast.”

The key near-term test is whether the tightening technical structure resolves upward as Bird expects and whether cross-asset risk appetite continues to support alt beta. If both align, Bird’s framework suggests traders will be watching for a momentum break that could carry XRP toward the $2.69 objective and, in his view, potentially open the door to a faster path toward fresh cycle highs.

At press time, XRP traded at $2.06.

XRP price chart
Disclaimer: The articles reposted on this site are sourced from public platforms and are provided for informational purposes only. They do not necessarily reflect the views of MEXC. All rights remain with the original authors. If you believe any content infringes on third-party rights, please contact [email protected] for removal. MEXC makes no guarantees regarding the accuracy, completeness, or timeliness of the content and is not responsible for any actions taken based on the information provided. The content does not constitute financial, legal, or other professional advice, nor should it be considered a recommendation or endorsement by MEXC.

You May Also Like

Bitcoin ETFs Surge with 20,685 BTC Inflows, Marking Strongest Week

Bitcoin ETFs Surge with 20,685 BTC Inflows, Marking Strongest Week

TLDR Bitcoin ETFs recorded their strongest weekly inflows since July, reaching 20,685 BTC. U.S. Bitcoin ETFs contributed nearly 97% of the total inflows last week. The surge in Bitcoin ETF inflows pushed holdings to a new high of 1.32 million BTC. Fidelity’s FBTC product accounted for 36% of the total inflows, marking an 18-month high. [...] The post Bitcoin ETFs Surge with 20,685 BTC Inflows, Marking Strongest Week appeared first on CoinCentral.
Share
Coincentral2025/09/18 02:30
XAG/USD retreats toward $113.00 on profit-taking pressure

XAG/USD retreats toward $113.00 on profit-taking pressure

The post XAG/USD retreats toward $113.00 on profit-taking pressure appeared on BitcoinEthereumNews.com. Silver price (XAG/USD) halts its seven-day winning streak
Share
BitcoinEthereumNews2026/01/30 10:21
BTC Leverage Builds Near $120K, Big Test Ahead

BTC Leverage Builds Near $120K, Big Test Ahead

The post BTC Leverage Builds Near $120K, Big Test Ahead appeared on BitcoinEthereumNews.com. Key Insights: Heavy leverage builds at $118K–$120K, turning the zone into Bitcoin’s next critical resistance test. Rejection from point of interest with delta divergences suggests cooling momentum after the recent FOMC-driven spike. Support levels at $114K–$115K may attract buyers if BTC fails to break above $120K. BTC Leverage Builds Near $120K, Big Test Ahead Bitcoin was trading around $117,099, with daily volume close to $59.1 billion. The price has seen a marginal 0.01% gain over the past 24 hours and a 2% rise in the past week. Data shared by Killa points to heavy leverage building between $118,000 and $120,000. Heatmap charts back this up, showing dense liquidity bands in that zone. Such clusters of orders often act as magnets for price action, as markets tend to move where liquidity is stacked. Price Action Around the POI Analysis from JoelXBT highlights how Bitcoin tapped into a key point of interest (POI) during the recent FOMC-driven spike. This move coincided with what was called the “zone of max delta pain”, a level where aggressive volume left imbalances in order flow. Source: JoelXBT /X Following the test of this area, BTC faced rejection and began to pull back. Delta indicators revealed extended divergences, with price rising while buyer strength weakened. That mismatch suggests demand failed to keep up with the pace of the rally, leaving room for short-term cooling. Resistance and Support Levels The $118K–$120K range now stands as a major resistance band. A clean move through $120K could force leveraged shorts to cover, potentially driving further upside. On the downside, smaller liquidity clusters are visible near $114K–$115K. If rejection holds at the top, these levels are likely to act as the first supports where buyers may attempt to step in. Market Outlook Bitcoin’s next decisive move will likely form around the…
Share
BitcoinEthereumNews2025/09/18 16:40