

BNB Price Prediction As Binance Shifts SAFU To Bitcoin
The BNB token recorded $3.6 billion in trading volume, as the price fell back to trade within the falling wedge pattern, as the Binance exchange disclosed plans to convert the SAFU fund’s $1 billion stablecoin reserves into Bitcoin within 30 days to restore the fund to $1 billion if price fluctuations push its value below $800 million.
Binance Coin price has dropped 5.1% in the last 24 hours to $841.54 as of 04:04 a.m. EST, as the crypto market also fell over 5% to $2.89 trillion, according to Coingecko data.
As a result of this continued drop, BTC dropped sharply, reaching its lowest level in over two months, as a wave of forced liquidations hit leveraged traders while investors weighed the potential impact of a US Federal Reserve leadership change.
Data from Coinglass show that roughly $1.74 billion in leveraged positions were wiped out over the past 24 hours amid the sell-off, with 93% of these coming from long positions.
Binance To Shift $1 billion User Protection Fund Into Bitcoin
Binance, the world’s largest crypto exchange by trading volume, announced a plan to convert the entire $1 billion reserve of its Secure Asset Fund for Users (SAFU) from stablecoins into BTC over the next 30 days.
The fund was created to protect users from losses caused by unforeseen events, such as data breaches. It added that if bitcoin’s price swings drop the fund’s value below $800 million, the exchange will top it back up to $1 billion.
“This initiative is part of Binance’s long-term industry-building efforts, and we will continue to advance related work, gradually sharing more progress with the community,” Binance said on X.
Under the outlined plan, the exchange will gradually acquire BTC as a way of avoiding sudden market disruption, a bold move by a centralized exchange to back up user funds with BTC.
Converting $1 billion over 30 days implies roughly $33 million in daily BTC purchases, which could, in turn, help stabilize the cryptocurrency’s drawdowns.
Furthermore, with the $800 million rebalance threshold, Binance will commit to buying the dip if the BTC price falls sharply.
CZ Denies Large-Scale BNB Selling By Binance
As the crypto market corrected, Binance founder Changpeng ‘CZ’ Zhao denied allegations that the exchange engaged in large-scale selling of various cryptocurrencies, which may have contributed to the sustained market decline.
According to CZ, the negative rumors are harmful to the broader market but not personally impactful.
According to CZ, he and Binance have not engaged in any “meaningful” selling activities, and any personal sales have been limited to daily expenses.
CZ’s comments follow allegations that the co-founder and the exchange have engaged in market manipulation and self-serving practices over the years.
BNB Price Drops Below Key Support, Risks A Sustained Plunge
The BNB price has fallen back below the 50-day Simple Moving Average (SMA), reinforcing the narrative of a sustained decline.
After a dramatic surge in October 2025, Binance Coin entered a correction and began trading within a well-defined falling wedge pattern.
After a breakout early this year, the price of BNB is back below the lower boundary of the wedge, as sentiment changed to bearish.
BNB’s Relative Strength Index (RSI) also supports the overall bearish trend, as it continues to drop towards the 30-oversold region, currently at 36.74.
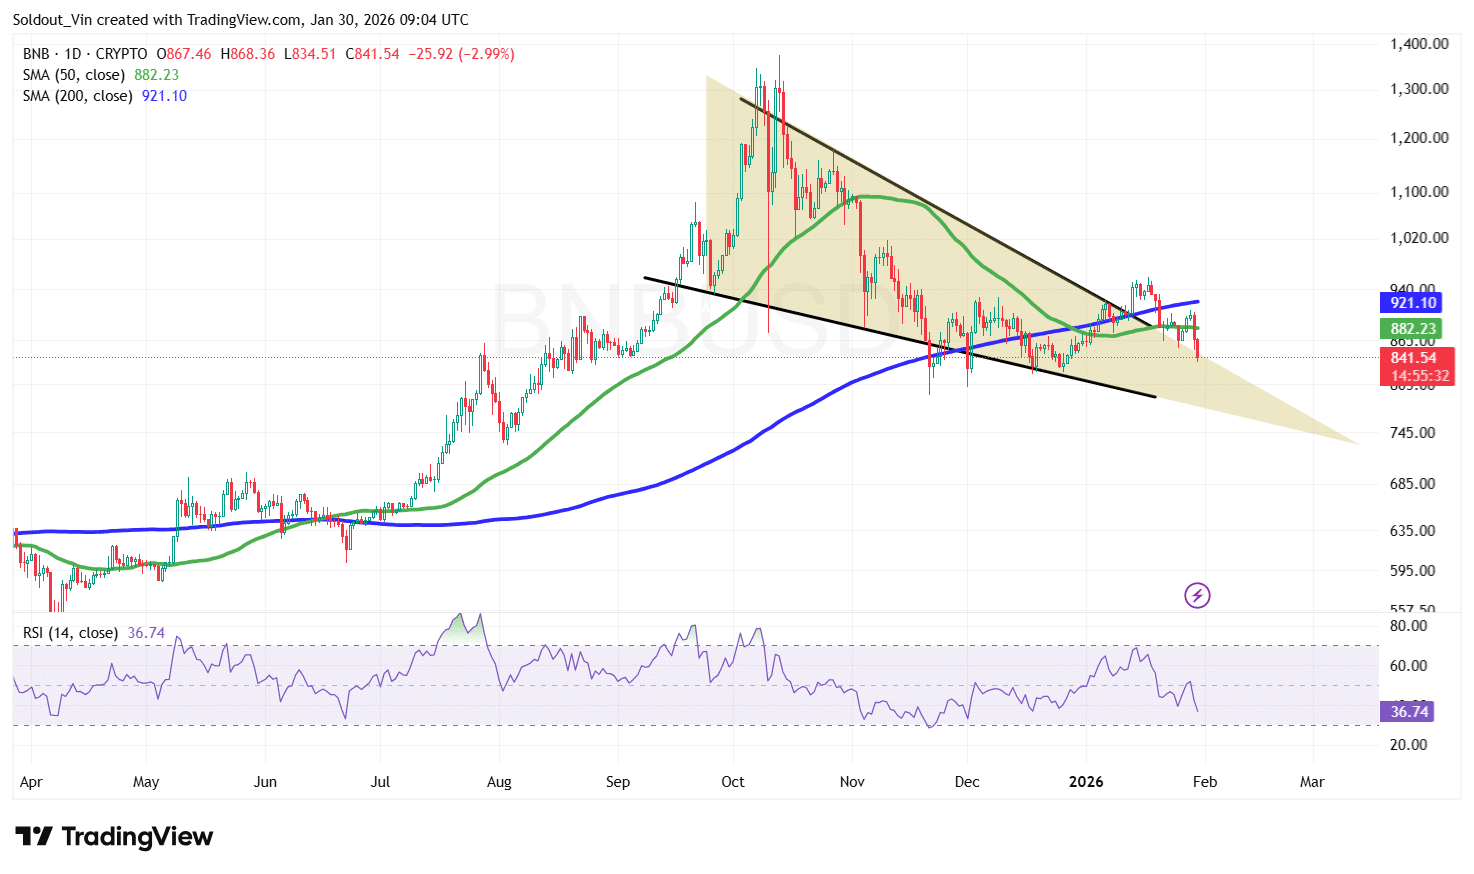 BNB/USD Chart Analysis Source: TradingView
With the price of the Binance Coin dropping back within the upper boundary of the falling wedge pattern, the outlook is currently bearish, as the price now risks a sustained drop back deep within the wedge.
If the bears continue to exert pressure, BNB risks a continued downtrend towards the $820.63 support area, which acted as a strong demand area in late 2025. This could be pushed by the SMAs forming around $884.27, with the 200-day SMA moving above the 50-day SMA.
Conversely, if the Binance Coin reclaims the 50-day SMA resistance level around $882.23 and manages to close above the 200-day SMA ($921), the next key target will be the $1,000 psychological zone.
Related News:
You May Also Like

SBI VC Trade Launches Ripple’s RLUSD in Japan

Ethereum koers toont zeldzaam dubbel koopsignaal en richt zich op $4.550


