

Uniswap (UNI) Price Prediction 2026, 2027-2030
- Bullish UNI price prediction for 2026 is $7.913 to $12.074.
- Uniswap (UNI) price might reach $25 soon.
- Bearish UNI price prediction for 2026 is $3.302.
In this Uniswap (UNI) price prediction 2026, 2027-2030, we will analyze the price patterns of UNI by using accurate trader-friendly technical analysis indicators and predict the future movement of the cryptocurrency.
|
TABLE OF CONTENTS
|
|
INTRODUCTION
|
|
|
UNISWAP (UNI) PRICE PREDICTION 2026
|
|
| Uniswap (UNI) PRICE PREDICTION 2027, 2028-2030 |
| CONCLUSION |
| FAQ |
Uniswap (UNI) Current Market Status
| Current Price | $4.27 |
| 24 – Hour Price Change | 7.87% Down |
| 24 – Hour Trading Volume | $288.65M |
| Market Cap | $2.71B |
| Circulating Supply | 634.83M UNI |
| All – Time High | $44.97 (On May 03, 2021) |
| All – Time Low | $0.419 (On Sep 17, 2020) |
What is Uniswap (UNI)
| TICKER | UNI |
| BLOCKCHAIN | Uniswap blockchain |
| CATEGORY | Public blockchain platform |
| LAUNCHED ON | November 2018 |
| UTILITIES | Governance, Fast Transactions, gas fees & rewards |
Uniswap (UNI) is the governance token of Uniswap, one of the fully decentralized exchanges. Uniswap is a decentralized exchange protocol existing on Ethereum. It equips the Ethereum network with automated market makers (AMMs) and thereby enhances the ease of swapping ERC-20 tokens.
UNI was launched as an ERC-20 token in 2020. Uniswap (UNI) grants voting rights to users for participating in the governance proposals of Uniswap.
Uniswap platform enables permissionless listing of ERC-20 tokens. Any listed ERC-20 token gets its own exchange smart contract and liquidity pool on Uniswap. Users can trade ERC-20 tokens with ease and can also contribute to the liquidity pool. Liquidity providers (LPs) earn a 0.3% fee for contributing to the pool. The price of tokens on Uniswap is determined based on the supply and demand of the tokens held in the pool.
Uniswap was launched in November 2018, and the subsequent upgraded iterations, V2 and V3, were launched in 2020 and 2021, respectively.
However, in a statement released on September 4th, Uniswap Labs, the developer of a decentralized exchange (DEX), was charged by the US Commodity Futures Trading Commission (CFTC) for unlawfully offering leveraged cryptocurrency trading to retail investors in the United States.
Uniswap 24H Technicals
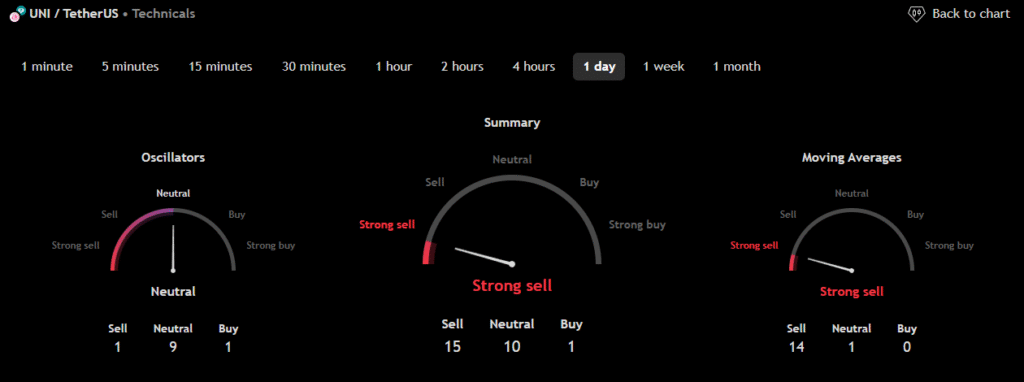 (Source: TradingView)
Uniswap (UNI) Price Prediction 2026
Uniswap (UNI) ranks 32nd on CoinMarketCap in terms of its market capitalization. The overview of the Uniswap price prediction for 2026 is explained below with a daily time frame.
In the above chart, Uniswap (UNI) laid out a Horizontal channel pattern. The Horizontal channel pattern is also known as the sideways trend. In general, the horizontal channel is formed during the price consolidation. In this pattern, the upper trendline, the line that connects the highs, and the lower trendline, the line that connects the lows, run horizontally parallel, and the price action is contained within it.
A horizontal channel is often regarded as one of the suitable patterns for timing the market, as the buying and selling points are in consolidation.
At the time of analysis, the price of Uniswap (UNI) was recorded at $4.27. If the pattern trend continues, then the price of UNI might reach the resistance levels of $12.215 and $32.049. If the trend reverses, then the price of UNI may fall to the support of $7.594 and $4.710.
Uniswap (UNI) Resistance and Support Levels
The chart given below elucidates the possible resistance and support levels of Uniswap (UNI) in 2026.
From the above chart, we can analyze and identify the following as resistance and support levels of Uniswap (UNI) for 2026.
| Resistance Level 1 | $7.913 |
| Resistance Level 2 | $12.074 |
| Support Level 1 | $4.885 |
| Support Level 2 | $3.302 |
UNI Resistance & Support Levels
Uniswap (UNI) Price Prediction 2026 — RVOL, MA, and RSI
The technical analysis indicators, such as Relative Volume (RVOL), Moving Average (MA), and Relative Strength Index (RSI) of Bitcoin (UNI) are shown in the chart below.
From the readings on the chart above, we can make the following inferences regarding the current Uniswap (UNI) market in 2026.
| INDICATOR | PURPOSE | READING | INFERENCE |
| 50-Day Moving Average (50MA) | Nature of the current trend by comparing the average price over 50 days | 50 MA = $6.754Price = $7.227 (50MA <Price) | Bullish/Uptrend |
| Relative Strength Index (RSI) | Magnitude of price change;Analyzing oversold & overbought conditions | 53.319 <30 = Oversold 50-70 = Neutral>70 = Overbought | Neutral |
| Relative Volume (RVOL) | Asset’s trading volume in relation to its recent average volumes | Below cutoff line | Weak volume |
Uniswap (UNI) Price Prediction 2026 — ADX, RVI
In the below chart, we analyze the strength and volatility of Uniswap (UNI) using the following technical analysis indicators — Average Directional Index (ADX) and Relative Volatility Index (RVI).
From the readings on the chart above, we can make the following inferences regarding the price momentum of Uniswap (UNI).
| INDICATOR | PURPOSE | READING | INFERENCE |
| Average Directional Index (ADX) | Strength of the trend momentum | 7.666 | Weak Trend |
| Relative Volatility Index (RVI) | Volatility over a specific period | 40.05 <50 = Low >50 = High | Low volatility |
Comparison of UNI with BTC, ETH
Let us now compare the price movements of Uniswap (UNI) with those of Bitcoin (BTC), and Ethereum (ETH).
From the above chart, we can interpret that the price action of UNI is similar to that of BTC and ETH. That is, when the price of BTC and ETH increases or decreases, the price of UNI also increases or decreases respectively.
Uniswap (UNI) Price Prediction 2027, 2028 – 2030
With the help of the aforementioned technical analysis indicators and trend patterns, let us predict the price of Uniswap (UNI) between 2027, 2028, 2029, and 2030.
| Year | Bullish Price | Bearish Price |
| Uniswap (UNI) Price Prediction 2027 | $27 | $4 |
| Uniswap (UNI) Price Prediction 2028 | $29 | $3 |
| Uniswap (UNI) Price Prediction 2029 | $31 | $2 |
| Uniswap (UNI) Price Prediction 2030 | $33 | $1 |
Conclusion
If Uniswap (UNI) establishes itself as a good investment in 2026, this year would be favorable to the cryptocurrency. In conclusion, the bullish Uniswap (UNI) price prediction for 2026 is $12.074. Comparatively, if unfavorable sentiment is triggered, the bearish Uniswap (UNI) price prediction for 2026 is $3.302.
If the market momentum and investors’ sentiment positively elevate, then Uniswap (UNI) might hit $25. Furthermore, with future upgrades and advancements in the Uniswap ecosystem, UNI might surpass its current all-time high (ATH) of $44.97 and mark its new ATH.
FAQ
1. What is Uniswap (UNI)?
Uniswap (UNI) is the governance token of Uniswap, a decentralized exchange protocol on Ethereum that facilitates the smooth swapping of ERC-20 tokens. UNI was launched in 2020.
2. Where can you buy Uniswap (UNI)?
Traders can trade Uniswap (UNI) on the following cryptocurrency exchanges such as Binance, BlueBit, Zedcex Exchange, OKX, and Bybit.
3. Will Uniswap (UNI) record a new ATH soon?
With the ongoing developments and upgrades within the Uniswap platform, Uniswap (UNI) has a high possibility of reaching its ATH soon.
4. What is the current all-time high (ATH) of Uniswap (UNI)?
Uniswap (UNI) hit its current all-time high (ATH) of $44.97 on May 03, 2021.
5. What is the lowest price of Uniswap (UNI)?
According to CoinMarketCap, UNI hit its all-time low (ATL) of $0.419 on Sep 17, 2020.
6. Will Uniswap (UNI) hit $25?
If Uniswap (UNI) becomes one of the active cryptocurrencies that maintains a bullish trend, it might rally to hit $25 soon.
7. What will be the Uniswap (UNI) price by 2027?
Uniswap (UNI) price might reach $27 by 2027.
8. What will be the Uniswap (UNI) price by 2028?
Uniswap (UNI) price might reach $29 by 2028.
9. What will be the Uniswap (UNI) price by 2029?
Uniswap (UNI) price might reach $31 by 2029.
10. What will be the Uniswap (UNI) price by 2030?
Uniswap (UNI) price might reach $33 by 2030.
Top Crypto Predictions
VeChain (VET) Price Prediction
dogwifhat (WIF) Price Prediction
Flow (FLOW) Price Prediction
Disclaimer: The opinion expressed in this article is solely the author’s. It does not represent any investment advice. TheNewsCrypto team encourages all to do their own research before investing.
You May Also Like

Crucial Fed Rate Cut: October Probability Surges to 94%

Hedera (HBAR) Price Today, Chart & Market Cap | Live HBAR to USD Converter
