

Bitcoin Price Forecast: BTC struggles below $115,000 as tariff woes continue to dent sentiment
- Bitcoin price trades below $115,000 as it faces resistance at $116,000.
- US-listed spot Bitcoin ETFs recorded an outflow of $333 million on Monday, marking a three-day streak of withdrawals.
- Derivatives market traders are adopting defensive positions as tariff-related uncertainty sparks renewed selling pressure.
Bitcoin (BTC) price trades below $115,000 at the time of writing on Tuesday, hinting at renewed signs of weakness as it faces resistance from a key resistance level and markets remain cautious. The bearish picture is further supported by the falling institutional demand, with spot Bitcoin Exchange Traded Funds (ETFs) extending an outflow streak to the third day.
Tariff uncertainty sparks risk-off sentiment for Bitcoin
Bitcoin price declined sharply last week as it failed to close above its psychological level at $120,000 and fell to a weekly low of $111,920. Two events contributed to this price correction of nearly 5%:
First, the long-awaited Working Group report on Digital Assets failed to provide details on the Strategic Bitcoin Reserve. Second, the US Federal Reserve (Fed) hawkish stance and US President Donald Trump's new tariffs announcement triggered a sell-off not only in riskier assets such as Bitcoin but also in US equities.
Trade tariff rates to dozens of countries that haven't reached a deal with the US are expected to go live on Thursday, which could bring more uncertainty and volatility to the crypto markets.
Institutional demand shows early signs of weakness, hinting at a possible downturn in BTC. According to the SoSoValue data, US spot Bitcoin ETFs recorded an outflow of $333.19 million on Monday, continuing its three-day streak of outflows since the end of July. If these outflow intensities, BTC could see further correction in its prices.
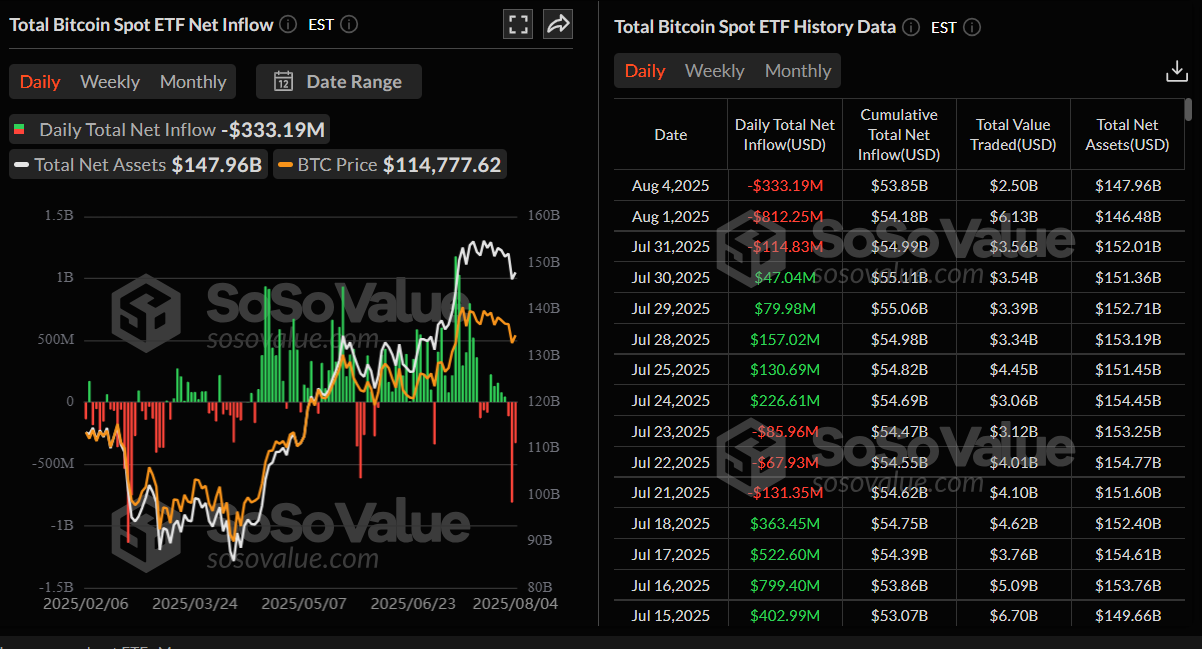
Total Bitcoin Spot ETF Net inflow daily chart. Source: SoSovalue
BTC CME traders take a cautious stance
K33 Research's report published on Tuesday highlights that BTC traders on the Chicago Mercantile Exchange (CME) remain cautious.
The report shows that Notional Open Interest (OI) on BTC has declined below 140,000 BTC on Tuesday, approaching lows not seen since early May. Moreover, as of Monday, BITX held a BTC equivalent exposure of 45,580 BTC, marking the lowest exposure of the 2x leveraged ETF since April 10, as traders hold a cautious bias.
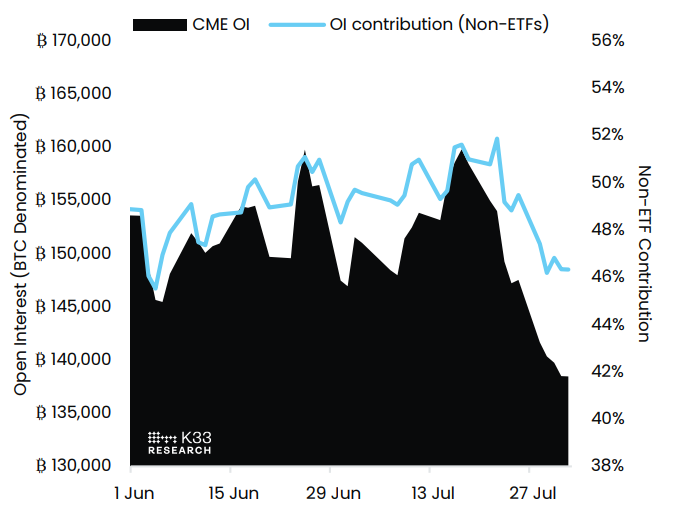
CME BTC Futures Open Interest chart. Source: K33 Research
Moreover, the declining exposure from purely long directional participants such as BITX has pushed futures premiums toward two-month lows, as shown in the graph below.
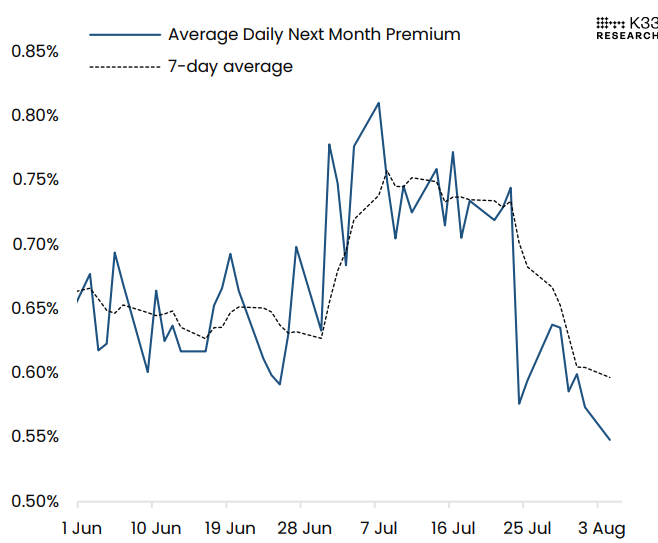
CME BTC Futures Average Daily Next Month Premium chart. Source: K33 Research
Looking down on the annualized 1-month futures premiums in BTC, which reached lows of 4.5% on Friday, saw a modest uptick on Monday as traders maintain a defensive posture. The term structure also signals a defensive bias.
All these derivative data points toward a broad reluctance to build long exposure in the market as BTC enters a period typically associated with challenging seasonal effects.
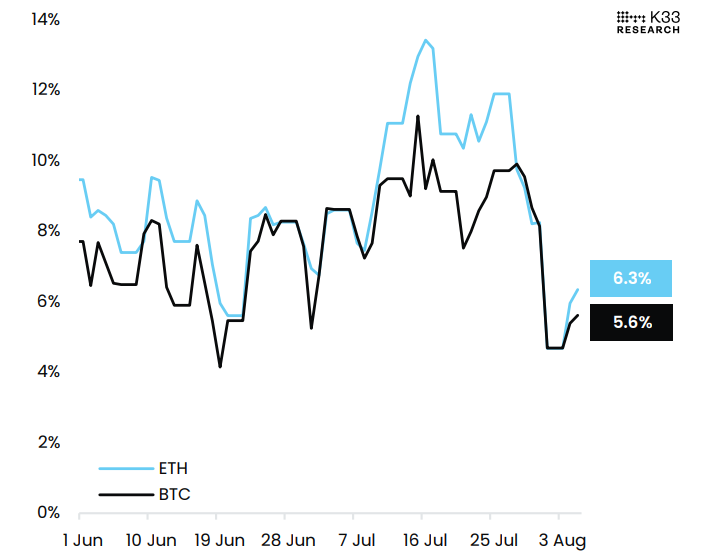
CME BTC and ETH Futures annualized rolling 1-month basis chart Source: K33 Research
Bitcoin Price Forecast: A dead cat bounce scenario in play
On the 4-hour chart, Bitcoin shows a 1.48% rebound on Sunday after dropping 6% between Monday and Saturday, following its failure to close above the key $120,000 psychological resistance last week.
At the start of this week, on Monday, BTC faced a rejection from its 50% price retracement level at $115,455, drawn from Thursday’s high of $118,879 to Saturday's low of $112,032. At the time of writing on Tuesday, it trades down at around $114,500.
The price analysis discussed above shows the formation of a dead-cat bounce — a brief price increase within a broader downtrend — facing rejection from the 50% price retracement level at $118,879. This level roughly coincides with the 50-Exponential Moving Average (EMA) calculated on a 4-hour chart, making these levels a crucial reversal zone.
If BTC continues its downward trend, it could extend the decline to retest its Saturday low of $112,032.
The Relative Strength Index (RSI) on the 4-hour chart reads 44 after facing rejection from its neutral level of 50 on Monday, supporting the bearish thesis.
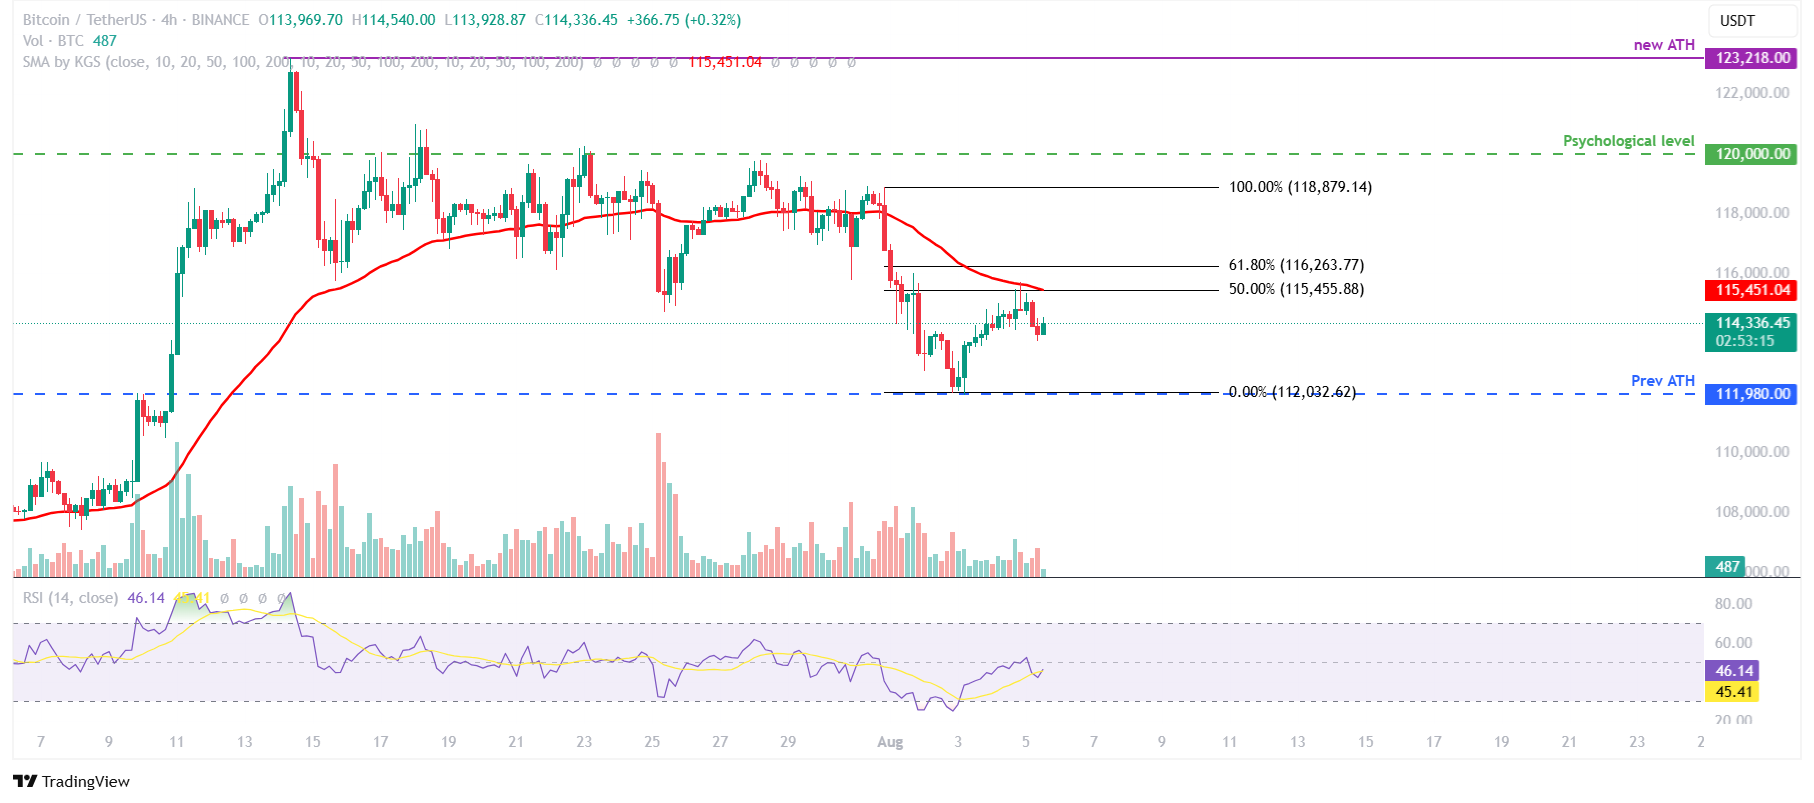
BTC/USDT 4-hr chart
The daily chart shows that BTC broke below its lower consolidation level at $116,000 on Thursday and declined nearly 3% in the next two days, retesting its 50-day Exponential Moving Average at around $113,041. This 50-day EMA roughly coincides with the previous all-time high of $111,980, making it a key support zone.
On Sunday, BTC found support around this zone and recovered 2.2% until the next day, nearing its lower consolidation at $116,000.
If the 116,000 holds as resistance, BTC could extend the decline to retest its 50-day EMA at $113,041.
The RSI on the daily chart reads 46, after facing rejection from its neutral level of 50, indicating bearish momentum is gaining traction. The Moving Average Convergence Divergence (MACD) showed a bearish crossover on July 23 that still holds, indicating bearish momentum.
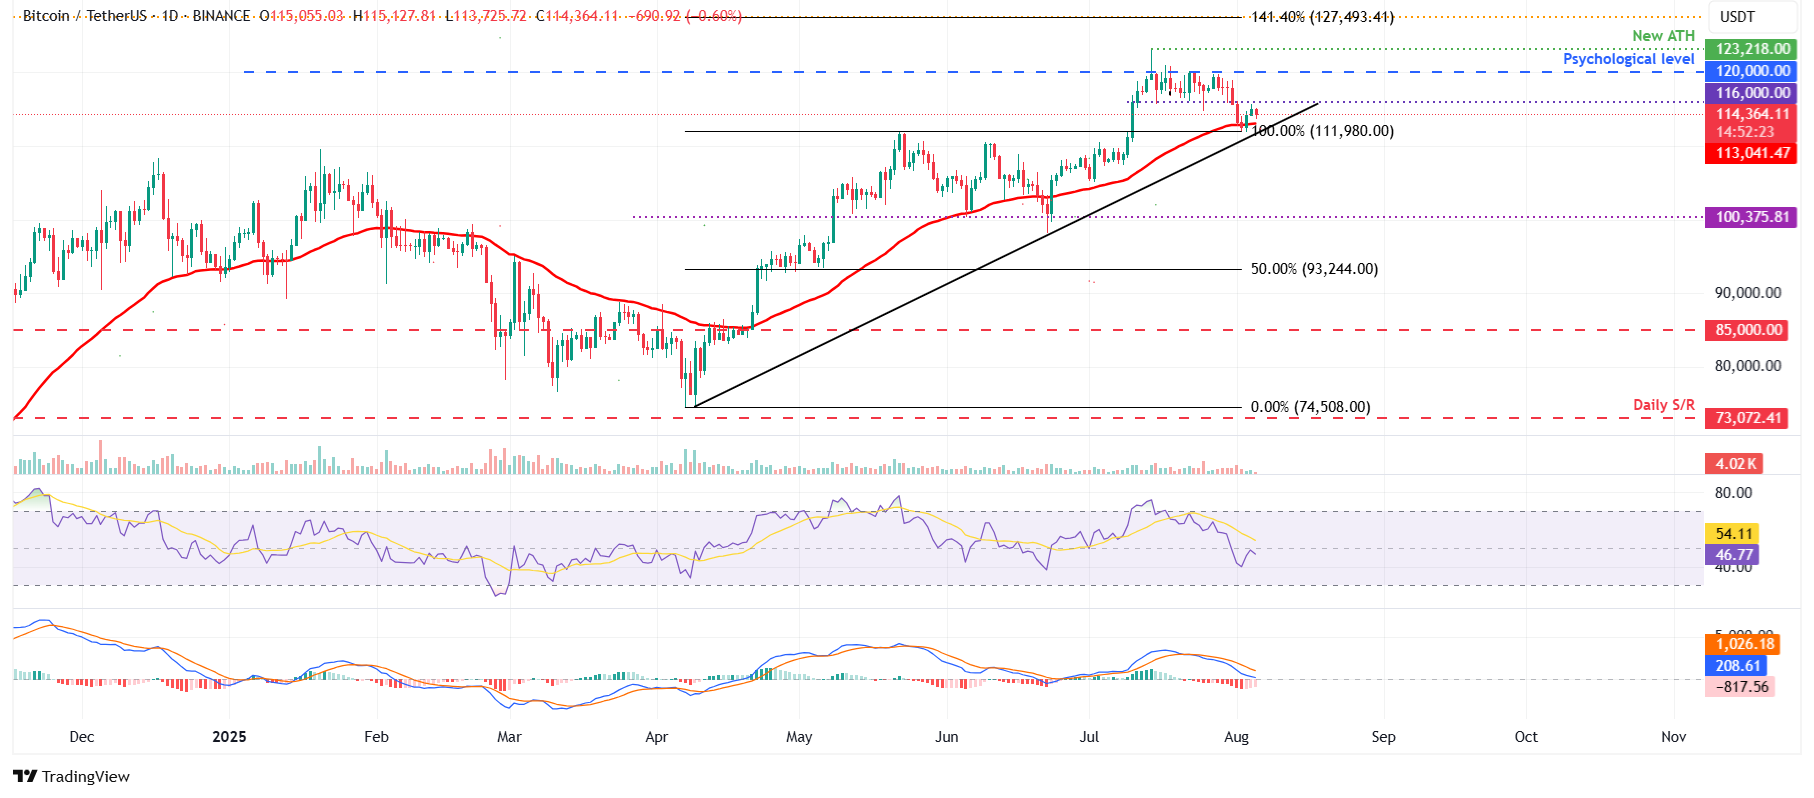
BTC/USDT daily chart
However, if BTC closes above $116,000 on a daily basis, it could aim for its key psychological level at $120,000.
Bitcoin, altcoins, stablecoins FAQs
Bitcoin is the largest cryptocurrency by market capitalization, a virtual currency designed to serve as money. This form of payment cannot be controlled by any one person, group, or entity, which eliminates the need for third-party participation during financial transactions.
Altcoins are any cryptocurrency apart from Bitcoin, but some also regard Ethereum as a non-altcoin because it is from these two cryptocurrencies that forking happens. If this is true, then Litecoin is the first altcoin, forked from the Bitcoin protocol and, therefore, an “improved” version of it.
Stablecoins are cryptocurrencies designed to have a stable price, with their value backed by a reserve of the asset it represents. To achieve this, the value of any one stablecoin is pegged to a commodity or financial instrument, such as the US Dollar (USD), with its supply regulated by an algorithm or demand. The main goal of stablecoins is to provide an on/off-ramp for investors willing to trade and invest in cryptocurrencies. Stablecoins also allow investors to store value since cryptocurrencies, in general, are subject to volatility.
Bitcoin dominance is the ratio of Bitcoin's market capitalization to the total market capitalization of all cryptocurrencies combined. It provides a clear picture of Bitcoin’s interest among investors. A high BTC dominance typically happens before and during a bull run, in which investors resort to investing in relatively stable and high market capitalization cryptocurrency like Bitcoin. A drop in BTC dominance usually means that investors are moving their capital and/or profits to altcoins in a quest for higher returns, which usually triggers an explosion of altcoin rallies.
You May Also Like

Securities Fraud Investigation Into Corcept Therapeutics Incorporated (CORT) Announced – Shareholders Who Lost Money Urged To Contact Glancy Prongay Wolke & Rotter LLP, a Leading Securities Fraud Law Firm

BlackRock boosts AI and US equity exposure in $185 billion models
