The post Hyperliquid Price Stalls at $46 Amid Whale Moves, Here’s What’s Next appeared first on Coinpedia Fintech News Hyperliquid is showing signs of consolidation after an impressive 60-day rally of more than 23%. Currently trading across exchanges at $45.54, the token has shed 0.68% since yesterday, but still remains up 7.92% for the week. Following this, its valuation stands at $15.2 billion, while the intraday trading volume shot up 43.77% to $375.75 million. …The post Hyperliquid Price Stalls at $46 Amid Whale Moves, Here’s What’s Next appeared first on Coinpedia Fintech News Hyperliquid is showing signs of consolidation after an impressive 60-day rally of more than 23%. Currently trading across exchanges at $45.54, the token has shed 0.68% since yesterday, but still remains up 7.92% for the week. Following this, its valuation stands at $15.2 billion, while the intraday trading volume shot up 43.77% to $375.75 million. …

Hyperliquid Price Stalls at $46 Amid Whale Moves, Here’s What’s Next

2 min read
Hyperliquid Price

The post Hyperliquid Price Stalls at $46 Amid Whale Moves, Here’s What’s Next appeared first on Coinpedia Fintech News

Hyperliquid is showing signs of consolidation after an impressive 60-day rally of more than 23%. Currently trading across exchanges at $45.54, the token has shed 0.68% since yesterday, but still remains up 7.92% for the week. Following this, its valuation stands at $15.2 billion, while the intraday trading volume shot up 43.77% to $375.75 million.

It is worth noting that the token recently faced stiff rejection near the $49.52 swing high, just shy of its ATH at $49.86 recorded last month. That being said, marketers appear to be taking profits as macro uncertainty and mixed whale behavior cloud the near-term outlook.

Reasons Behind the Recent Dip

  • Fed rate uncertainty: The 87.3% probability of a September rate cut is fueling cautious positioning.
  • Mixed whale activity: Large addresses remain divided, with aggressive spot accumulation clashing against leveraged short positions.
  • Liquidation clusters: The $42–$44 range is packed with leveraged positions.

Hyperliquid Price Analysis

HYPE’s price action shows a crucial battle between bulls and bears. The 38.2% Fibonacci retracement level at $44.21 now acts as an important support zone. A sustained close below $42.57 could drag the price down to $35.42 if liquidations intensify.

HYPE price 26-8-25

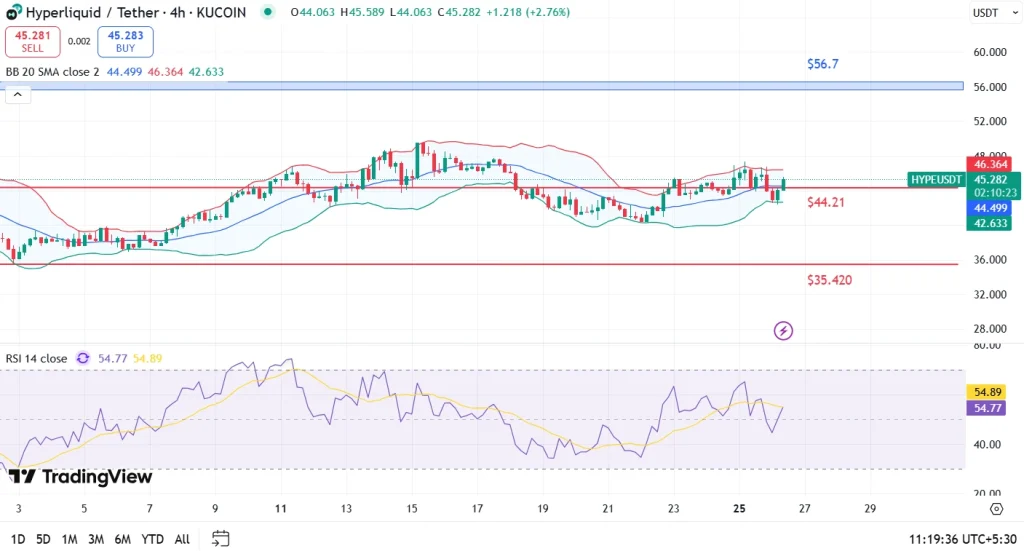
The Bollinger Bands on the 4-hour chart indicate shrinking volatility, while the RSI at 54.7 signals neutral momentum. This suggests the market could swing in either direction depending on whether buyers can defend the mid-$40 region.

On the upside, bulls need to reclaim $46.36 and push past $49.52 to retest the ATH at $49.86. A breakout above that level could extend the rally toward the $56.7 resistance zone.

FAQs

What is HYPE price today?

HYPE price today is consolidating around $45 after a strong 60-day rally.

Where could Hyperliquid price head next?

Key support sits at $44.21 and $42.57, while resistance is at $46.36 and $49.52.

Why did Hyperliquid’s price drop?

Caution around Fed rate policy, profit-taking by traders, and mixed whale activity pressured prices.

Market Opportunity
Moonveil Logo
Moonveil Price(MORE)
$0.000664
$0.000664$0.000664
-11.84%
USD
Moonveil (MORE) Live Price Chart
Disclaimer: The articles reposted on this site are sourced from public platforms and are provided for informational purposes only. They do not necessarily reflect the views of MEXC. All rights remain with the original authors. If you believe any content infringes on third-party rights, please contact [email protected] for removal. MEXC makes no guarantees regarding the accuracy, completeness, or timeliness of the content and is not responsible for any actions taken based on the information provided. The content does not constitute financial, legal, or other professional advice, nor should it be considered a recommendation or endorsement by MEXC.

You May Also Like

Top Altcoins To Hold Before 2026 For Maximum ROI – One Is Under $1!

Top Altcoins To Hold Before 2026 For Maximum ROI – One Is Under $1!

BlockchainFX presale surges past $7.5M at $0.024 per token with 500x ROI potential, staking rewards, and BLOCK30 bonus still live — top altcoin to hold before 2026.
Share
Blockchainreporter2025/09/18 01:16
UBS CEO Targets Direct Crypto Access With “Fast Follower” Tokenization Strategy

UBS CEO Targets Direct Crypto Access With “Fast Follower” Tokenization Strategy

The tension in UBS’s latest strategy update is not between profit and innovation, but between speed and control. On February 4, 2026, as the bank reported a record
Share
Ethnews2026/02/05 04:56
Cryptos Signal Divergence Ahead of Fed Rate Decision

Cryptos Signal Divergence Ahead of Fed Rate Decision

The post Cryptos Signal Divergence Ahead of Fed Rate Decision appeared on BitcoinEthereumNews.com. Crypto assets send conflicting signals ahead of the Federal Reserve’s September rate decision. On-chain data reveals a clear decrease in Bitcoin and Ethereum flowing into centralized exchanges, but a sharp increase in altcoin inflows. The findings come from a Tuesday report by CryptoQuant, an on-chain data platform. The firm’s data shows a stark divergence in coin volume, which has been observed in movements onto centralized exchanges over the past few weeks. Bitcoin and Ethereum Inflows Drop to Multi-Month Lows Sponsored Sponsored Bitcoin has seen a dramatic drop in exchange inflows, with the 7-day moving average plummeting to 25,000 BTC, its lowest level in over a year. The average deposit per transaction has fallen to 0.57 BTC as of September. This suggests that smaller retail investors, rather than large-scale whales, are responsible for the recent cash-outs. Ethereum is showing a similar trend, with its daily exchange inflows decreasing to a two-month low. CryptoQuant reported that the 7-day moving average for ETH deposits on exchanges is around 783,000 ETH, the lowest in two months. Other Altcoins See Renewed Selling Pressure In contrast, other altcoin deposit activity on exchanges has surged. The number of altcoin deposit transactions on centralized exchanges was quite steady in May and June of this year, maintaining a 7-day moving average of about 20,000 to 30,000. Recently, however, that figure has jumped to 55,000 transactions. Altcoins: Exchange Inflow Transaction Count. Source: CryptoQuant CryptoQuant projects that altcoins, given their increased inflow activity, could face relatively higher selling pressure compared to BTC and ETH. Meanwhile, the balance of stablecoins on exchanges—a key indicator of potential buying pressure—has increased significantly. The report notes that the exchange USDT balance, around $273 million in April, grew to $379 million by August 31, marking a new yearly high. CryptoQuant interprets this surge as a reflection of…
Share
BitcoinEthereumNews2025/09/18 01:01