Dogecoin price rare pattern points to a 50% surge despite ETF drought
Dogecoin price rose for two consecutive days this week as Bitcoin and most altcoins stabilized.
- Dogecoin price has formed a double-bottom pattern on the daily chart.
- Demand for DOGE ETFs has waned this month.
- The volume and futures open interest have continued rising.
Dogecoin (DOGE) token was trading at $0.09 today, March 10, up slightly from this month’s low of $0.087. This rebound is happening even as demand for the three spot DOGE ETFs wanes completely.
Data shows that Grayscale’s GDOG, 21Shares’s TDOG, and Bitwise’s BWOW have accumulated over $7.45 million in inflows. Their net assets have moved to $8.97 million, a tiny amount for one of the biggest coins in the crypto industry.
Most notably, these funds have added just $779k in assets this month. They have not had any inflows in the last five consecutive days. In contrast, spot Solana ETFs have had $955 million in inflows since their inception and $21 million this month.
On the positive side, data shows that the volume in the spot and futures markets is improving. CoinGlass numbers show that its volume on Tuesday jumped to over $2.6 billion, the third consecutive day of gains. It has soared from $1.4 billion on Sunday.
Dogecoin’s futures open interest has also stabilized above the $1.2 billion range. Also, the weighted funding rate turned green, a sign that traders in the futures market expect it to rebound.
Dogecoin price technical analysis
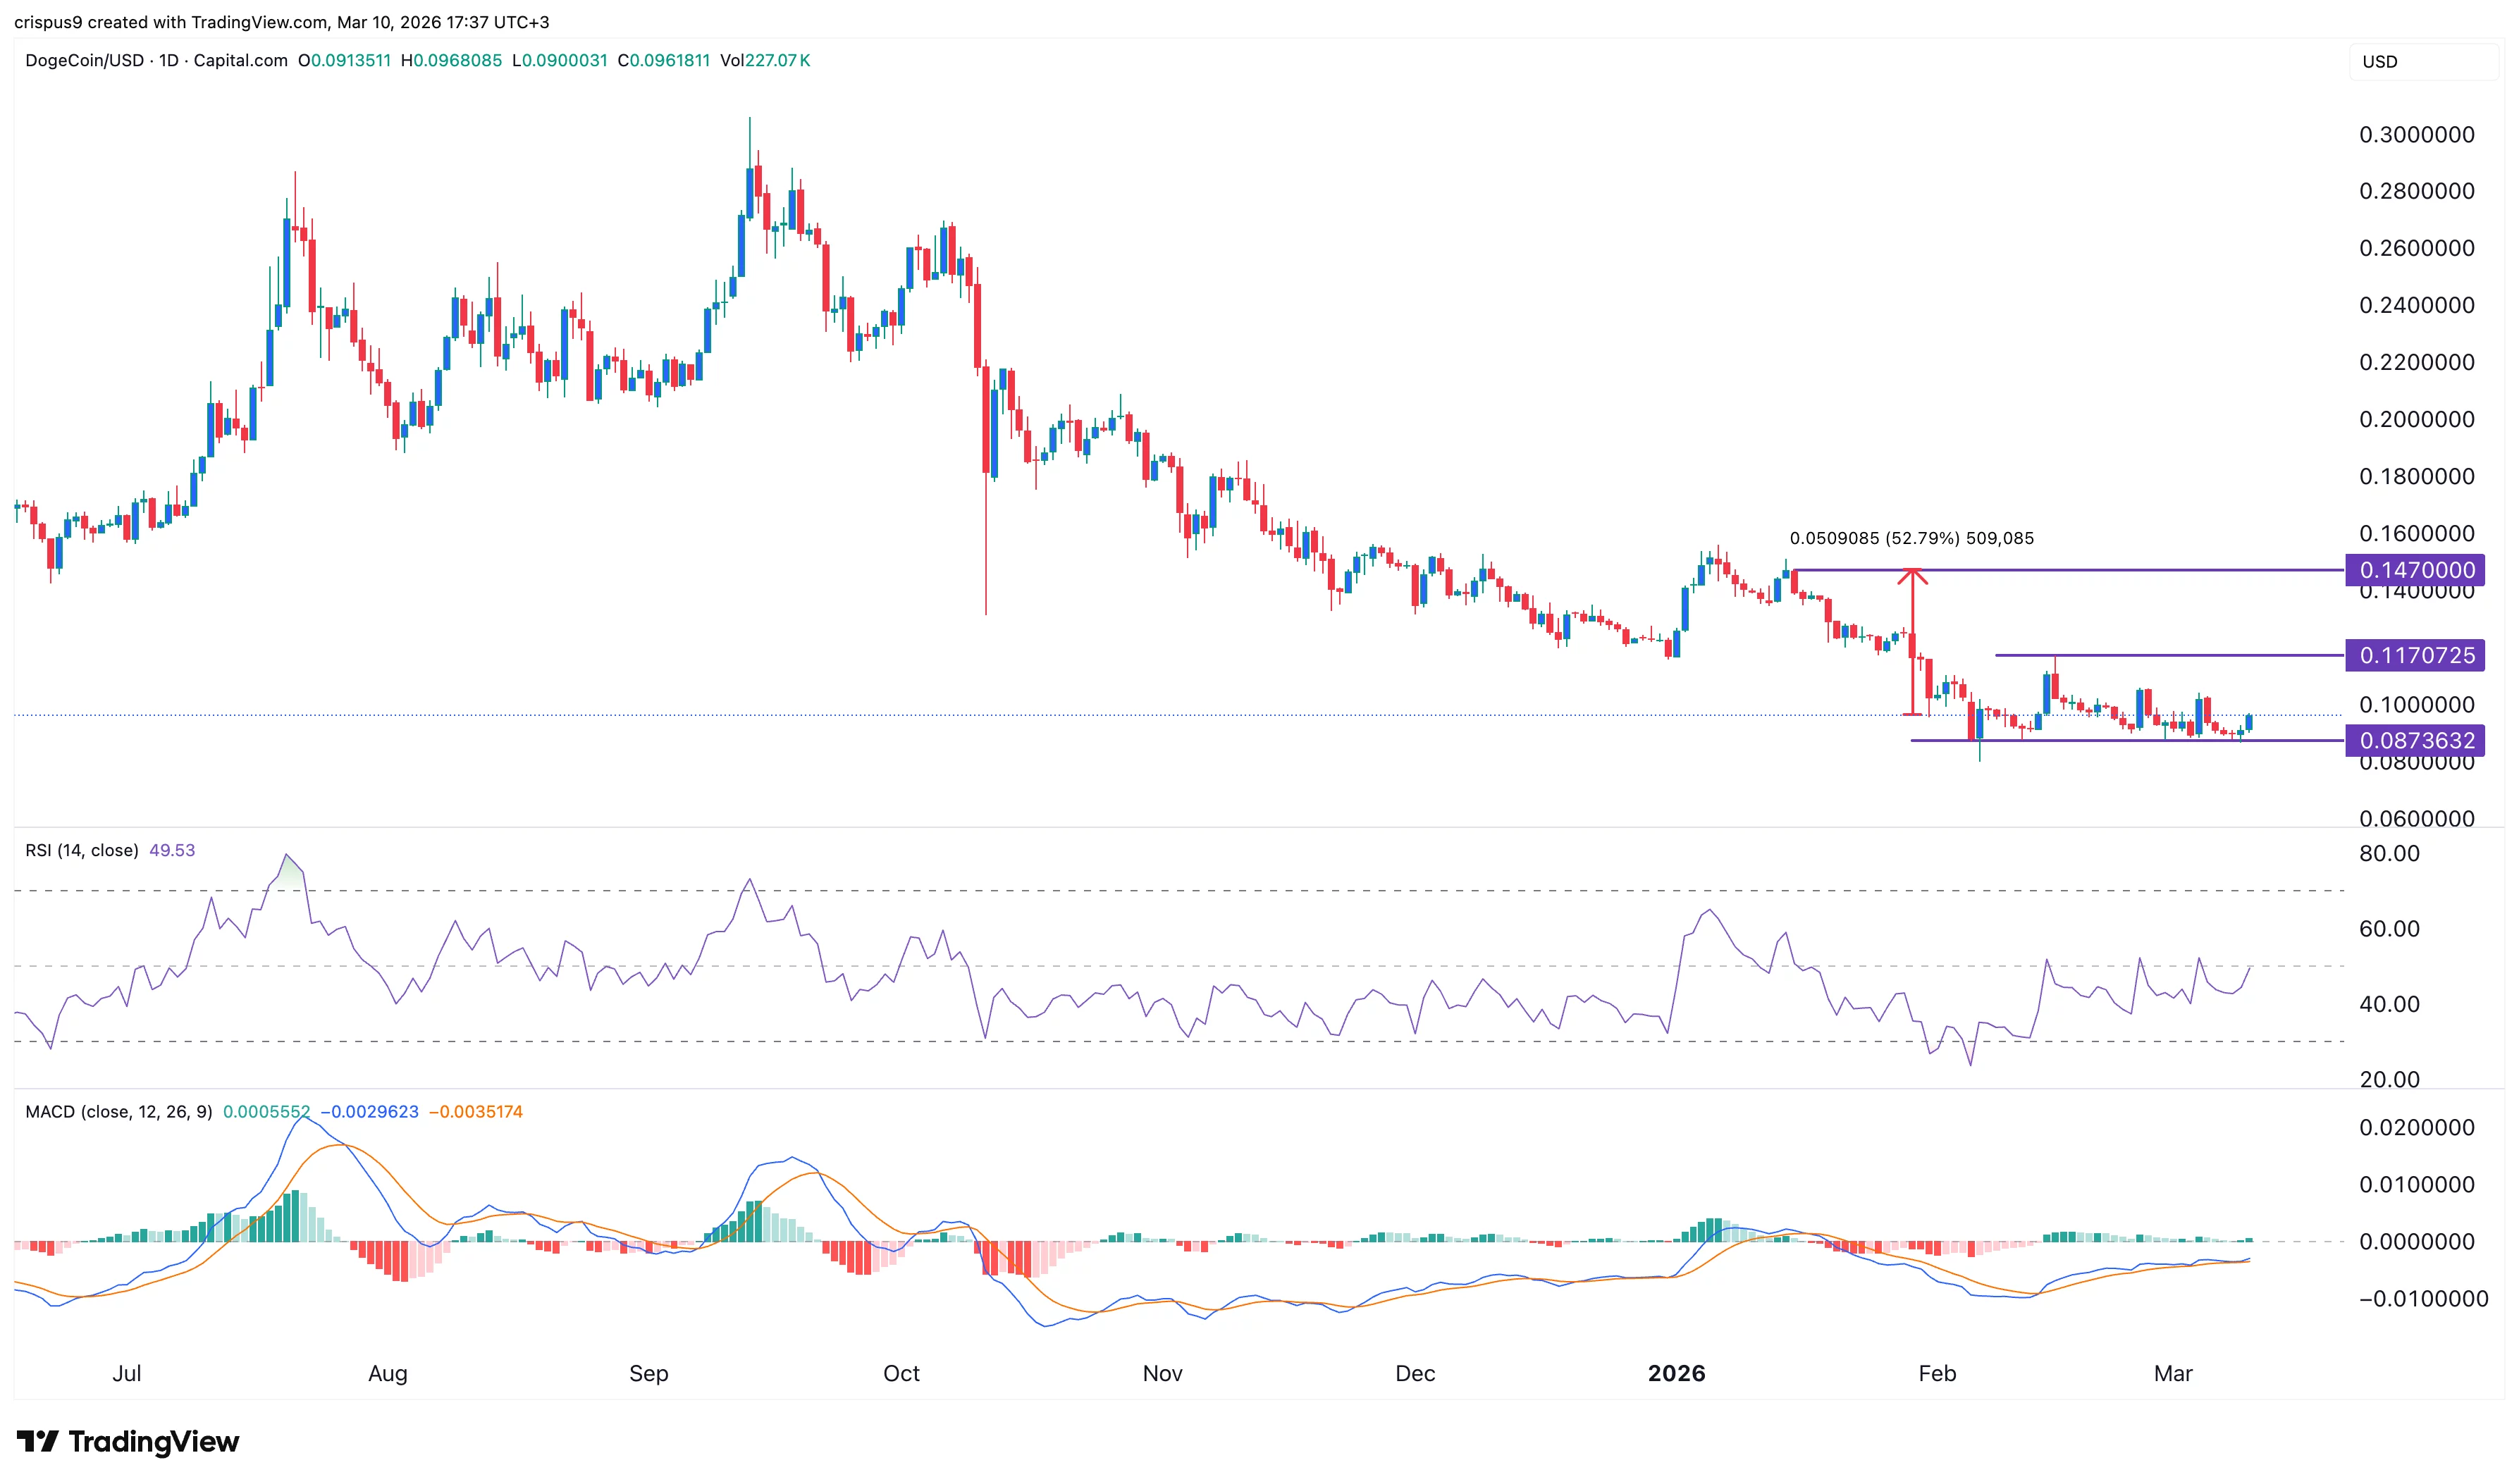
The daily chart is showing that the DOGE price has bottomed. It formed a double-bottom-like pattern at $0.0877, its lowest level in February and March. Its neckline was at $0.1170, its highest swing on February 15 this year.
A double-bottom pattern signals that bears are afraid of placing trades below that price. The price target is established by estimating the height by subtracting the double-bottom from the neckline. In this case, the height is $0.030. One then adds this figure to the neckline, giving it a target of $0.1470.
Other indicators are pointing to a rebound. For example, the Relative Strength Index has jumped to the neutral point of 50, while the MACD indicator is nearing the zero line.
Therefore, the token will likely bounce back, with the initial target being the neckline at $0.1170. A move above that level will point to further gains to the double-bottom target at $0.1470, which is about 50% above the current level.
You May Also Like

USD/CAD Consolidation Holds with Firm Support – Scotiabank’s Crucial Analysis

CryptoQuant Analyst: "Bitcoin Bullishness Continues, But We Are in Its Final Stage!" He Also Announced a Date for the Summit!