

Ethereum price eyes 15% upside as a giant inverse H&S pattern takes shape

Ethereum price could be poised for significant upside as it forms a bullish reversal setup, as inflows into spot Ethereum ETFs return after a week of downturn.
- Ethereum price is down 8% from its weekly high.
- Exchange balances have hit an all-time low amid accumulation by DATs.
- A multi-year inverse head and shoulders is forming on the weekly chart.
According to data from crypto.news, Ethereum (ETH) was trading at $3,113 at last check on Dec. 15 morning Asian time, down 8% since last Thursday and 37.1% from its all-time high reached in August this year.
The downtrend was led by a drop in network activity, profit-taking by investors, and risk-averse sentiment among investors surrounding macroeconomic concerns and massive liquidations that hit the broader crypto market.
However, there are underlying signs that suggest Ethereum could be entering a consolidation phase before a massive upside in the weeks ahead.
First, the supply of the asset held on centralized exchanges has dropped to a record low of 8.7%, the lowest since the network launched in mid-2015. This happened as more ETH went into staking, restaking, and digital asset treasuries (DAT) focused on accumulating it. Notably, Tom Lee-led Bitmine, the most prominent among them, bought another $73.2 million just yesterday.
Typically, when exchange balances drop lower, they tend to reduce sell-side pressure, which could support price appreciation if investor demand for the asset remains high.
Second, U.S. spot Ethereum ETFs have returned to inflows over the past week, drawing nearly $209 million after a week of outflows. Investors typically tend to go bullish on an asset when it attracts institutional demand.
Ethereum price analysis
On the weekly chart, Ethereum price appears to be forming a massive inverse head and shoulders pattern, which is often a precursor for a bullish reversal.
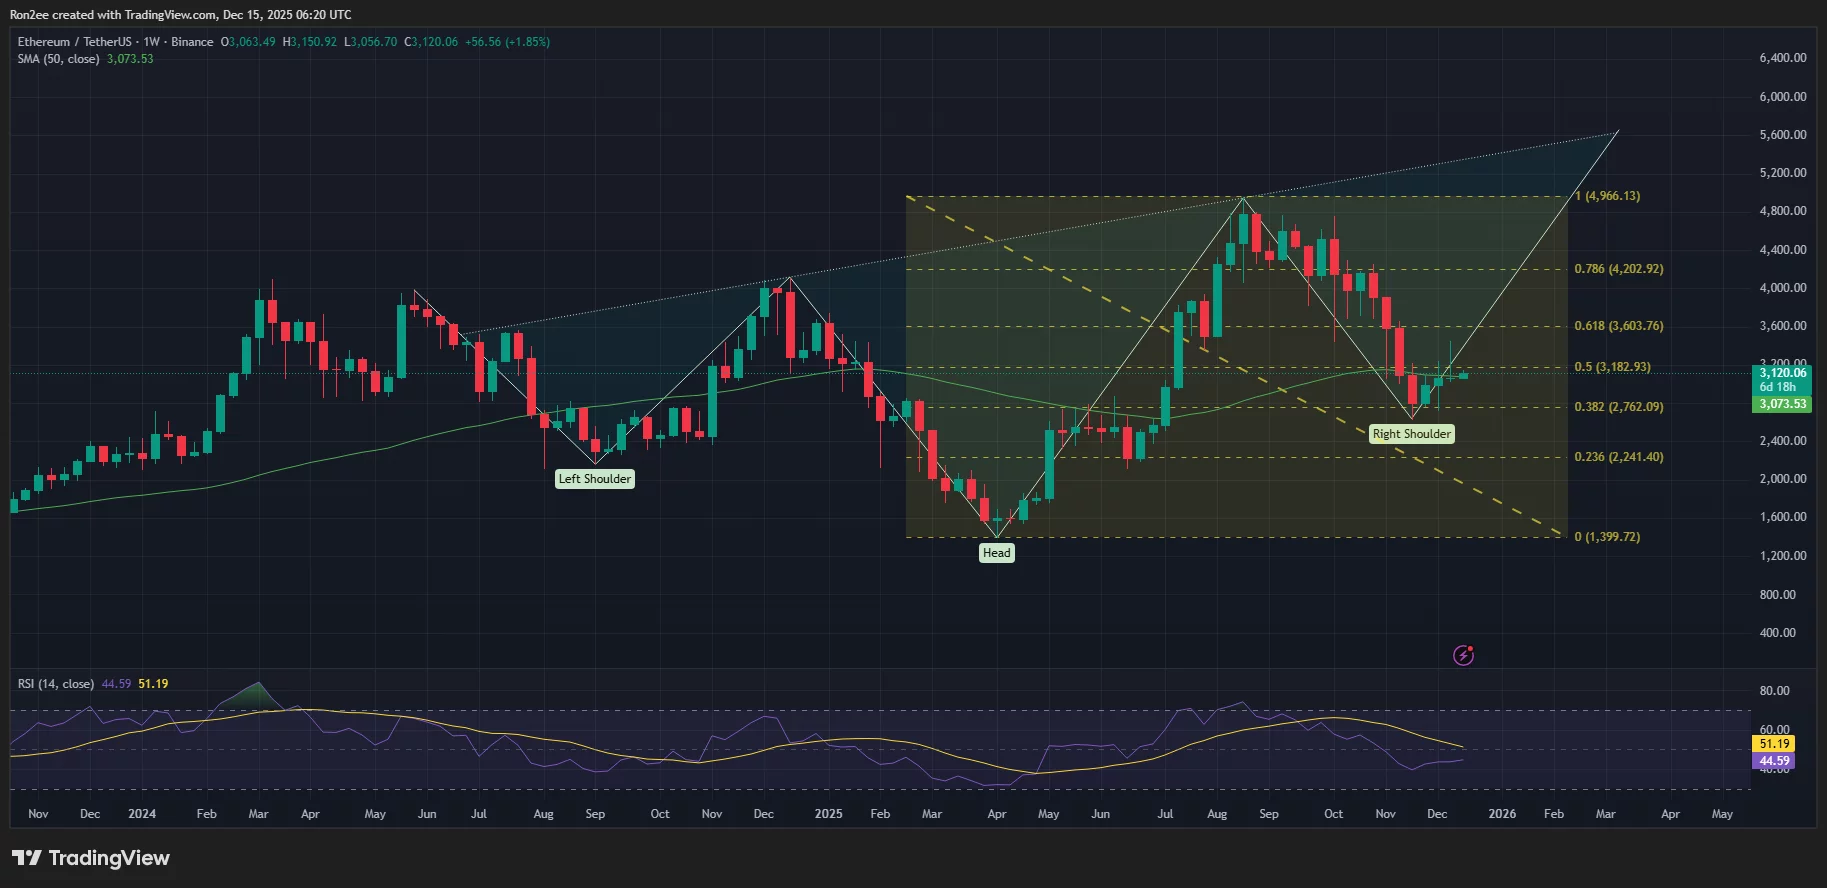
Simultaneously, Ether price has moved above the 50-day moving average, a crucial level, a break above which has led to strong rallies previously.
Furthermore, the relative strength index has been steadily pointing upwards, a telltale sign that buying pressure for the token is starting to return.
For now, the immediate target for Ether next lies at around $3,600, 15.65% higher than its current price. The level also aligns with the 61.8% Fibonacci retracement level, making it a key resistance area that traders would follow.
On the contrary, $2,760, which aligns with the 38.2% Fibonacci retracement level below, could act as the next major support level to keep an eye on if the price faces renewed selling pressure.
Disclosure: This article does not represent investment advice. The content and materials featured on this page are for educational purposes only.
Ayrıca Şunları da Beğenebilirsiniz

XRP price weakens at critical level, raising risk of deeper pullback
Copy linkX (Twitter)LinkedInFacebookEmail

Grayscale’s XRP, SOL, ADA Fund To Begin Trading Tomorrow Following SEC’s Greenlight
Read the full article at coingape.com.
