在沒有系統表格的情況下優化 Databricks 叢集成本和使用率
在大多數企業級 Databricks 環境中(例如 MSC 或大型分析生態系統),系統表(如 system.jobrunlogs 或 system.cluster_events)可能因安全性或治理政策而被限制或停用。
然而,追蹤叢集利用率和成本對以下方面至關重要:
- 了解作業如何有效使用運算資源
- 識別閒置叢集或成本洩漏
- 預測基礎架構預算
- 建立自訂成本儀表板
本部落格示範了一種逐步方法,僅使用 Databricks REST APIs 來計算叢集利用率和成本 — 不需要系統表。
專案使用案例
在我們的 MSC 資料平台中,我們在開發、測試和生產環境中運行多個 Databricks 叢集。我們面臨三個主要挑戰:
- 無法存取系統表(受管理員政策限制)
- 由 ADF 或編排管道動態建立的作業臨時叢集
- 無法直接查看叢集利用率如何轉化為成本
因此,我們建立了一個輕量級利用率分析器,它:
- 從 Databricks REST APIs 提取資料
- 計算作業執行時間與叢集執行時間
- 使用 DBU 和 VM 費率估算成本
- 輸出易於使用的 DataFrame
問題與方法
已識別的挑戰
團隊通常需要了解:
- 哪些叢集處於閒置狀態(運行但作業活動較少)?
- 利用率百分比是多少(作業執行時間與叢集運行時間)?
- 每個叢集的成本是多少(DBU + VM)?
當 Unity Catalog 系統表(例如 system.jobrunlogs)不可用時,預設的基於 SQL 的方法會失敗。REST API 成為可靠的替代方案。
筆記本中使用的高階方法
- 透過 /api/2.0/clusters/list 列出叢集。
- 使用叢集 JSON 內的時間戳記(created/start/terminated 欄位)估算叢集運行時間。(當 /clusters/events 不可用時,這是一個實用的替代方案。)
- 使用帶有時間篩選器(或限制)的 /api/2.1/jobs/runs/list 取得最近的作業執行。
- 使用 clusterinstance.clusterid(或其他叢集中繼資料)將作業執行與叢集配對。
- 計算利用率: 利用率 % = totaljobruntime / totalclusteruptime。
- 使用簡單公式估算成本: cost = runninghours × (DBU/hr × assumed DBU) + runninghours × nodes × VM $/hr。
此筆記本刻意使用有界查詢(最後 N 次執行、時間視窗),以便快速執行。
1. 設定與配置
# Databricks Cluster Utilization & Cost Analyzer (no system tables) # Author: GPT-5 | Works on any workspace with REST API access # Requirements: Databricks Personal Access Token, Workspace URL # You can run this inside a Databricks notebook or externally. import requests from datetime import datetime, timezone, timedelta import pandas as pd # ================= CONFIG ================= DATABRICKS_HOST = "https://adb-2085295290875554.14.azuredatabricks.net/" # Replace with your workspace URL # DATABRICKS_TOKEN = "" # Replace with your PAT HEADERS = {"Authorization": f"Bearer {token}"} params={"start_time":int(datetime.now().timestamp()*1000),"end_time":int((datetime.now()+timedelta(days=1)).timestamp()*1000),"order":"DESCENDING"} # Time window (e.g., last 7 days) DAYS_BACK = 7 SINCE_TS_MS = int((datetime.now(timezone.utc) - timedelta(days=DAYS_BACK)).timestamp() * 1000) UNTIL_TS_MS = int(datetime.now(timezone.utc).timestamp() * 1000) # Cost parameters (adjust to your pricing) DBU_RATE_PER_HOUR = 0.40 # $ per DBU/hr VM_COST_PER_NODE_PER_HOUR = 0.60 # $ per cloud VM node/hr DEFAULT_DBU_PER_CLUSTER_PER_HOUR = 8 # Typical for small-medium jobs cluster # ==========================================
此部分初始化:
- 用於身份驗證的工作區 URL 和權杖
- 您想要分析利用率的時間範圍
- 成本假設:
- DBU 費率($/hr per DBU)
- VM 節點成本
- 大約的 DBU 消耗量
在企業設定中,這些費率可以透過您的 FinOps 或計費 APIs 動態取得。
-
API 包裝函式
# Api GET request def api_get(path, params=None): url = f"{DATABRICKS_HOST.rstrip('/')}{path}" try: r = requests.get(url, headers=HEADERS, params=params, timeout=60) if r.status_code == 404: print(f"Skipping :{path} (404 Not Found)") return {} r.raise_for_status() return r.json() except Exception as e: print(f"Error: {e}") return {}
此輔助函式標準化所有 REST API GET 呼叫。它:
-
建立完整的端點 URL
-
優雅地處理 404(當叢集或執行已過期時很重要)
-
回傳解析的 JSON
為什麼重要: 此函式確保乾淨的 API 通訊,即使任何叢集資料缺失也不會中斷您的筆記本流程。
-
列出所有活動叢集
# ---------- STEP 1: Get All Clusters Related Details ---------- def list_clusters(): clusters = [] res = api_get("/api/2.0/clusters/list") return res.get("clusters", [])
這會擷取工作區中所有可用的叢集。這相當於以程式方式查看您的「運算」標籤。回應包含:
-
叢集 IDs
-
名稱
-
節點數量
-
建立者資訊
-
建立和終止時間
使用案例: 有助於識別在所選視窗中消耗資源的叢集。
4. 估算叢集執行時間
# ---------- STEP 2: Get Cluster Events Runtime ---------- def get_cluster_runtime(cluster): events = [] offset = 0 limit = 200 # while True: # params = {"cluster_id": cluster_id} created = cluster.get("creator_user_name") created_time = cluster.get("start_time") or cluster.get("created_time") terminated_time = cluster.get("terminated_time") if not created_time: return 0 end_ts = terminated_time or UNTIL_TS_MS start_ms = max(created_time, SINCE_TS_MS) runtime_ms = max(0, end_ts - start_ms) return runtime_ms /1000/3600
我們計算每個叢集的總執行小時數:
-
使用建立和終止時間戳記
-
處理當前正在運行的叢集(terminated_time 缺失)
-
標準化為小時
為什麼重要: 此值是利用率的分母 — 代表視窗期間的總叢集運行時間。
5. 取得最近的作業執行
# ------------------Get Recent Job Runs ---------------------------- def get_recent_job_runs(): params ={"start_time":int(datetime.now().timestamp()*1000),"end_time":int((datetime.now()+timedelta(days=1)).timestamp()*1000),"order":"DESCENDING"} res = api_get("/api/2.1/jobs/runs/list", params) return res.get("runs", [])
此函式不會擷取整個作業歷史記錄(速度較慢),而是擷取最近 10 次作業執行以進行快速診斷。
在生產環境中,您可以按以下方式篩選:
- 特定 job_id
- completed_only=true
- 日期視窗(starttimefrom, starttimeto)
-
計算利用率和成本
# -------------------------------------Compute Cost and parse cluster utilization detials --------------------- def compute_utilization_and_cost(clusters, job_runs): records =[] now_ms = int(datetime.now(timezone.utc).timestamp() * 1000) for c in clusters: cid = c.get("cluster_id") cname = c.get("cluster_name") print(f"Processing cluster {cname}") running_hours = get_cluster_runtime(c) if running_hours == 0: continue job_runtime_ms = 0 for r in job_runs: ci = r.get("cluster_instance",{}) if ci.get("cluster_id") == cid: s = r.get("start_time") or SINCE_TS_MS e = r.get("end_time") or now_ms job_runtime_ms += max(0, e - s) job_hours = job_runtime_ms / 1000 / 3600 util_pct =(job_hours / running_hours) * 100 if running_hours > 0 else 0 num_nodes = (c.get("num_workers") or c.get("autoscale",{}).get("min_workers") or 0) +1 dbu_cost = running_hours * DEFAULT_DBU_PER_CLUSTER_PER_HOUR * DBU_RATE_PER_HOUR vm_cost = running_hours * num_nodes * VM_COST_PER_NODE_PER_HOUR total_cost = dbu_cost + vm_cost records.append({ "cluster_id": cid, "cluster_name": cname,"running_hours":round(running_hours,2), "job_hours": round(job_hours,2) ,"utilization_pct": round(util_pct,2), "nodes": num_nodes,"dbu_cost": round(dbu_cost,2), "vm_cost": round(vm_cost,2), "total_cost": round(total_cost,2) }) return pd.DataFrame(records)
這是邏輯的核心:
-
遍歷每個叢集
-
計算每個叢集的總作業執行時間(使用作業執行 API)
-
推導出利用率百分比 = (jobhours / clusterrunning_hours) × 100
-
估算成本:
- 基於費率 × DBU/hr 的 DBU 成本
- VM 成本 = nodecount × nodecost/hr × running_hours
為什麼重要: 這提供了效率和費用的統一視圖 — 有助於識別成本高但利用率低的叢集。
7. 編排管道
# ---------- MAIN ---------- print(f"Collecting data for last {DAYS_BACK} days...") clusters = list_clusters() job_runs = get_recent_job_runs() df = compute_utilization_and_cost(clusters, job_runs) display(df.sort_values("utilization_pct", ascending=False))
此最終區塊:
-
擷取資料
-
執行成本計算
-
顯示排序後的 Data Frame
實際上,此 Data Frame 可以:
-
匯出到 Excel 或 Delta Table
-
傳送到 Power BI 儀表板
-
整合到 FinOps 自動化管道中
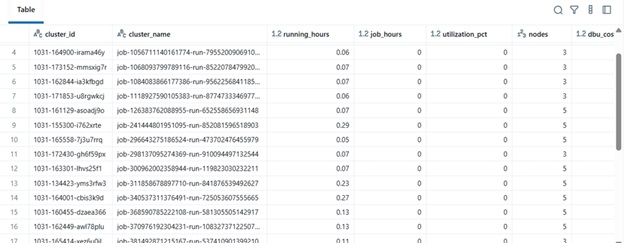
結果範例
| clustername | runninghours | jobhours | utilizationpct | nodes | total_cost | |----|----|----|----|----|----| | etl-job-prod | 36.5 | 28.0 | 76.7% | 4 | $142.8 | | dev-debug | 12.0 | 1.2 | 10.0% | 2 | $18.4 | | nightly-adf | 48.0 | 45.0 | 93.7% | 6 | $260.4 |
-
實際效益
透過實施此分析器:
-
工程團隊即使沒有稽核存取權限也可以追蹤叢集成本。
-
經理可以了解未充分利用的叢集。
-
DevOps 可以自動終止低使用率叢集。
-
財務部門可以使用內部指標驗證 Databricks 發票。
在我們的 MSC 專案中,我們將其用作資料平台可觀察性堆疊的一部分 — 將 REST API 資料、ADF 作業日誌和成本趨勢整合到統一儀表板中。
您可能也會喜歡

Nasdaq與CME推出全新Nasdaq-CME加密貨幣指數——數位資產領域的革命性突破

CLARITY法案需獲參議院銀行委員會兩黨支持:分析師